Electricity generation

Turbo generator
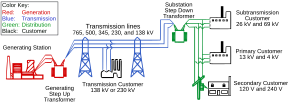
Diagram of an electric power system, generation system in red
Electricity generation is the process of generating electric power from sources of primary energy. For electric utilities in the electric power industry, it is the first stage in the delivery of electricity to end users, the other stages being transmission, distribution, energy storage and recovery, using pumped-storage method.
A characteristic of electricity is that it is not a primary energy freely present in nature in remarkable amounts and it must be produced. Production is carried out in power stations (also called "power plants"). Electricity is most often generated at a power plant by electromechanical generators, primarily driven by heat engines fueled by combustion or nuclear fission but also by other means such as the kinetic energy of flowing water and wind. Other energy sources include solar photovoltaics and geothermal power.
Contents
1 History
2 Methods of generating electricity
2.1 Generators
2.2 Electrochemistry
2.3 Photovoltaic effect
3 Economics of generation and production of electricity
4 Generating equipment
4.1 Turbines
4.2 Generators
5 Production
5.1 Historical results of production of electricity
5.2 Production by country
5.2.1 List of countries with source of electricity 2008
6 Environmental concerns
7 See also
8 References
History
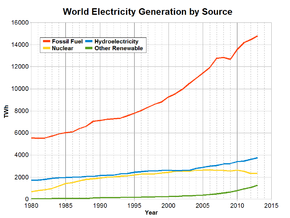
Electricity production in the World, 1980-2013
The fundamental principles of electricity generation were discovered in the 1820s and early 1830s by British scientist Michael Faraday. His method, still used today, is for electricity to be generated by the movement of a loop of wire, or disc of copper between the poles of a magnet. Central power stations became economically practical with the development of alternating current (AC) power transmission, using power transformers to transmit power at high voltage and with low loss.
In 1870, commercial electricity production started with the coupling of the dynamo to the hydraulic turbine. In 1870, the mechanical production of electric power began the Second Industrial Revolution and created inventions using the energy, whose major contributors were Thomas Alva Edison and Nikola Tesla. Previously the only way to produce electricity was by chemical reactions or using battery cells, and the only practical use of electricity was for the telegraph.
Electricity generation at central power stations started in 1882, when a steam engine driving a dynamo at Pearl Street Station produced a DC current that powered public lighting on Pearl Street, New York. The new technology was quickly adopted by many cities around the world, which adapted their gas fueled street lights to electric power, and soon after electric lights would be used in public buildings, in businesses, and to power public transport, such as trams and trains.
The first power plants used water power or coal;[1] and today a variety of energy sources are used, such as coal, nuclear, natural gas, hydroelectric, wind generators, and oil, as well as solar energy, tidal power, and geothermal sources. The use of power-lines and power-poles have been significantly important in the distribution of electricity.
Methods of generating electricity
2016 World [civil] power generation by source [IEA, 2018] (Percentages of 24.973 TWh)[2]
Coal (38.4%)
Natural Gas (23.2%)
Hydro (16.3%)
Nuclear fission (10.4%)
Oil (3.7%)
Non hydro renew. (8%)

U.S. 2014 Electricity Generation By Type.[3]

Sources of electricity in France in 2006;[4]nuclear power was the main source.
Several fundamental methods exist to convert other forms of energy into electrical energy. The triboelectric effect, piezoelectric effect, and even direct capture of the energy of nuclear decay Betavoltaics are used in niche applications, as is direct conversion of heat to electric power in the thermoelectric effect. Utility-scale generation is done by rotating electric generators, or by photovoltaic systems. A very small proportion of electric power distributed by utilities is provided by batteries.
Generators
Electric generators transform kinetic energy into electricity. This is the most used form for generating electricity and is based on Faraday's law. It can be seen experimentally by rotating a magnet within closed loops of a conducting material (e.g. copper wire). Almost all commercial electrical generation is done using electromagnetic induction, in which mechanical energy forces a generator to rotate:
Electrochemistry
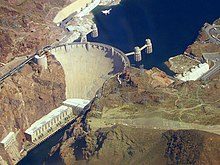
Large dams such as Hoover Dam can provide large amounts of hydroelectric power; it has 2.07 GW capability.
Electrochemistry is the direct transformation of chemical energy into electricity, as in a battery. Electrochemical electricity generation is important in portable and mobile applications. Currently, most electrochemical power comes from batteries.[5]Primary cells, such as the common zinc–carbon batteries, act as power sources directly, but secondary cells (i.e. rechargeable batteries) are used for storage systems rather than primary generation systems. Open electrochemical systems, known as fuel cells, can be used to extract power either from natural fuels or from synthesized fuels. Osmotic power is a possibility at places where salt and fresh water merges.
Photovoltaic effect
The photovoltaic effect is the transformation of light into electrical energy, as in solar cells. Photovoltaic panels convert sunlight directly to electricity. Although sunlight is free and abundant, solar power electricity is still usually more expensive to produce than large-scale mechanically generated power due to the cost of the panels. Low-efficiency silicon solar cells have been decreasing in cost and multijunction cells with close to 30% conversion efficiency are now commercially available. Over 40% efficiency has been demonstrated in experimental systems.[6] Until recently, photovoltaics were most commonly used in remote sites where there is no access to a commercial power grid, or as a supplemental electricity source for individual homes and businesses. Recent advances in manufacturing efficiency and photovoltaic technology, combined with subsidies driven by environmental concerns, have dramatically accelerated the deployment of solar panels. Installed capacity is growing by 40% per year led by increases in Germany, Japan, and the United States.
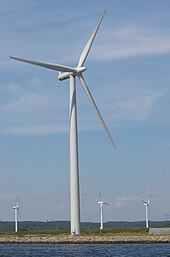
Wind turbines usually provide electrical generation in conjunction with other methods of producing power.
Economics of generation and production of electricity
The selection of electricity production modes and their economic viability varies in accordance with demand and region. The economics vary considerably around the world, resulting in widespread selling prices, e.g. the price in Venezuela is 3 cents per kWh while in Denmark it is 40 cents per kWh. Hydroelectric plants, nuclear power plants, thermal power plants and renewable sources have their own pros and cons, and selection is based upon the local power requirement and the fluctuations in demand. All power grids have varying loads on them but the daily minimum is the base load, supplied by plants which run continuously. Nuclear, coal, oil and gas plants can supply base load.
Thermal energy is economical in areas of high industrial density, as the high demand cannot be met by renewable sources. The effect of localized pollution is also minimized as industries are usually located away from residential areas. These plants can also withstand variation in load and consumption by adding more units or temporarily decreasing the production of some units.
Nuclear power plants can produce a huge amount of power from a single unit. However, recent disasters in Japan have raised concerns over the safety of nuclear power, and the capital cost of nuclear plants is very high.
Hydroelectric power plants are located in areas where the potential energy from falling water can be harnessed for moving turbines and the generation of power. It is not an economically viable source of production where the load varies too much during the annual production cycle and the ability to store the flow of water is limited.
Due to advancements in technology, and with mass production, renewable sources other than hydroelectricity (solar power, wind energy, tidal power, etc.) experienced decreases in cost of production, and the energy is now in many cases cost-comparative with fossil fuels. Many governments around the world provide subsidies to offset the higher cost of any new power production, and to make the installation of renewable energy systems economically feasible. However, their use is frequently limited by their intermittent nature.
If natural gas prices are below $3 per million British thermal units, generating electricity from natural gas is cheaper than generating power by burning coal.[7]
Generating equipment
Turbines
Almost all commercial electrical power on Earth is generated with a turbine, driven by wind, water, steam or burning gas. The turbine drives a generator, thus transforming its mechanical energy into electrical energy by electromagnetic induction. There are many different methods of developing mechanical energy, including heat engines, hydro, wind and tidal power. Most electric generation is driven by heat engines. The combustion of fossil fuels supplies most of the energy to these engines, with a significant fraction from nuclear fission and some from renewable sources. The modern steam turbine (invented by Sir Charles Parsons in 1884) currently generates about 80% of the electric power in the world using a variety of heat sources. Turbine types include:
- Steam
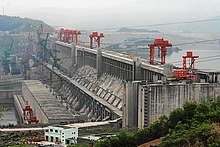
Large dams such as Three Gorges Dam in China can provide large amounts of hydroelectric power; it has a 22.5 GW capability.
- Water is boiled by coal burned in a thermal power plant, about 41% of all electricity is generated this way.[8]
Nuclear fission heat created in a nuclear reactor creates steam. Less than 15% of electricity is generated this way.- Renewables. The steam is generated by Biomass, Solar thermal energy where solar parabolic troughs and solar power towers concentrate sunlight to heat a heat transfer fluid, which is then used to produce steam, or Geothermal power.
- Water is boiled by coal burned in a thermal power plant, about 41% of all electricity is generated this way.[8]
- Natural gas: turbines are driven directly by gases produced by combustion. Combined cycle are driven by both steam and natural gas. They generate power by burning natural gas in a gas turbine and use residual heat to generate steam. At least 20% of the worlds electricity is generated by natural gas.
- Water Energy is captured from the movement of water. From falling water, the rise and fall of tides or ocean thermal currents. Each driving a water turbine to produce approximately 16% of the world's electricity.
- The windmill was a very early wind turbine. In a solar updraft tower wind is artificially produced. Before 2010 less than 2% of the worlds electricity was produced from wind.

Although turbines are most common in commercial power generation, smaller generators can be powered by gasoline or diesel engines. These may used for back up generation or isolated villages.
Generators

A large generator with the rotor removed
Electric generators were known in simple forms from the discovery of the magnetic induction of electric current in the 1830s. In general, some form of prime mover such as an engine or the turbines described above, drives a rotating magnetic field past stationary coils of wire thereby turning mechanical energy into electricity. A very large 2000 MW(2,682,000 horsepower) unit designed by Siemens was built for unit 3 at the Olkiluoto Nuclear Power Plant.[9] The only commercial scale electricity production that does not employ a generator is solar PV.
Production
The production of electricity in 2013 was 23,322TWh. Sources of electricity were coal and peat 41%, natural gas 22%, hydroelectric 16%, nuclear power 11%, oil 4%, biomass and waste 2% and other sources 4%. Other sources include wind, geothermal, solar photovoltaic, and solar thermal.[10]
| - | Coal | Oil | Natural Gas | Nuclear | Renewables | other | Total |
|---|---|---|---|---|---|---|---|
| Average electric power (TWh/year) | 8,263 | 1,111 | 4,301 | 2,731 | 3,288 | 568 | 20,261 |
| Average electric power (GW) | 942.6 | 126.7 | 490.7 | 311.6 | 375.1 | 64.8 | 2311.4 |
| Proportion | 41% | 5% | 21% | 13% | 16% | 3% | 100% |
- data source IEA/OECD

Energy Flow of Power Plant
Total energy consumed at all power plants for the generation of electricity was 4,398,768 ktoe (kilo ton of oil equivalent) which was 36% of the total for primary energy sources (TPES) of 2008.
Electricity output (gross) was 1,735,579 ktoe (20,185 TWh), efficiency was 39%, and the balance of 61% was generated heat. A small part (145,141 ktoe, which was 3% of the input total) of the heat was utilized at co-generation heat and power plants. The in-house consumption of electricity and power transmission losses were 289,681 ktoe.
The amount supplied to the final consumer was 1,445,285 ktoe (16,430 TWh) which was 33% of the total energy consumed at power plants and heat and power co-generation (CHP) plants.[11]
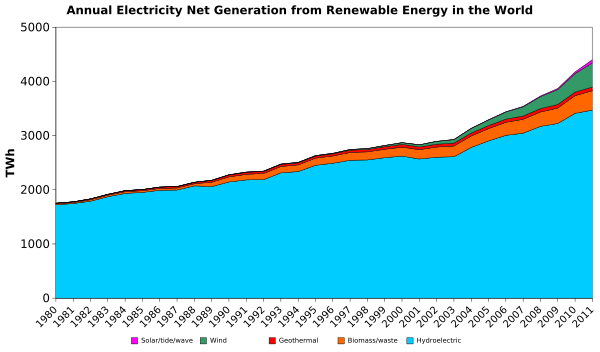
Historical results of production of electricity

Production by country
The United States has long been the largest producer and consumer of electricity, with a global share in 2005 of at least 25%, followed by China, Japan, Russia, and India. As of Jan-2010, total electricity generation for the two largest generators was as follows: USA: 3,992 billion kWh (3,992 TWh); China: 3,715 billion kWh (3,715 TWh).
List of countries with source of electricity 2008
Data source of values (electric power generated) is IEA/OECD.[12]
Listed countries are top 20 by population or top 20 by GDP (PPP) and Saudi Arabia based on CIA World Factbook 2009.[13]
| Country's electricity sector | Fossil Fuel | Nuclear | rank | Renewable | Bio other* | total | rank | |||||||||||
|---|---|---|---|---|---|---|---|---|---|---|---|---|---|---|---|---|---|---|
| Coal | Oil | Gas | sub total | rank | Hydro | Geo Thermal | Solar PV* | Solar Thermal | Wind | Tide | sub total | rank | ||||||
| World total | 8,263 | 1,111 | 4,301 | 13,675 | - | 2,731 | - | 3,288 | 65 | 12 | 0.9 | 219 | 0.5 | 3,584 | - | 271 | 20,261 | - |
| Proportion | 41% | 5.5% | 21% | 67% | - | 13% | - | 16% | 0.3% | 0.06% | 0.004% | 1.1% | 0.003% | 18% | - | 1.3% | 100% | - |
| 2,733 | 23 | 31 | 2,788 | 2 | 68 | 8 | 585 | - | 0.2 | - | 13 | - | 598 | 1 | 2.4 | 3,457 | 2 | |
| 569 | 34 | 82 | 685 | 5 | 15 | 12 | 114 | - | 0.02 | - | 14 | - | 128.02 | 6 | 2.0 | 830 | 5 | |
| 2,133 | 58 | 1011 | 3,101 | 1 | 838 | 1 | 282 | 17 | 1.6 | 0.88 | 56 | - | 357 | 4 | 73 | 4,369 | 1 | |
| 61 | 43 | 25 | 130 | 19 | - | - | 12 | 8.3 | - | - | - | - | 20 | 17 | - | 149 | 20 | |
| 13 | 18 | 29 | 59 | 23 | 14 | 13 | 370 | - | - | - | 0.6 | - | 370 | 3 | 20 | 463 | 9 | |
| 0.1 | 32 | 30 | 62 | 22 | 1.6 | 16 | 28 | - | - | - | - | - | 28 | 14 | - | 92 | 24 | |
| 0.6 | 1.7 | 31 | 33 | 27 | - | - | 1.5 | - | - | - | - | - | 1.5 | 29 | - | 35 | 27 | |
| - | 3.1 | 12 | 15 | 28 | - | - | 5.7 | - | - | - | - | - | 5.7 | 25 | - | 21 | 28 | |
| 197 | 16 | 495 | 708 | 4 | 163 | 4 | 167 | 0.5 | - | - | 0.01 | - | 167 | 5 | 2.5 | 1,040 | 4 | |
| 288 | 139 | 283 | 711 | 3 | 258 | 3 | 83 | 2.8 | 2.3 | - | 2.6 | - | 91 | 7 | 22 | 1,082 | 3 | |
| 21 | 49 | 131 | 202 | 13 | 9.8 | 14 | 39 | 7.1 | 0.01 | - | 0.3 | - | 47 | 12 | 0.8 | 259 | 14 | |
| 16 | 4.9 | 20 | 40 | 26 | - | - | 9.8 | 11 | 0.001 | - | 0.1 | - | 21 | 16 | - | 61 | 26 | |
| 15 | 1.6 | 30 | 47 | 25 | - | - | 26 | - | - | - | - | - | 26 | 15 | - | 73 | 25 | |
| - | 0.5 | - | 0.5 | 29 | - | - | 3.3 | 0.01 | - | - | - | - | 3.3 | 28 | - | 3.8 | 30 | |
| - | 26 | 90 | 115 | 20 | - | - | 15 | - | - | - | 0.9 | - | 16 | 20 | - | 131 | 22 | |
| 291 | 9.2 | 88 | 388 | 6 | 148 | 6 | 27 | 0.02 | 4.4 | - | 41 | - | 72 | 9 | 29 | 637 | 7 | |
| 58 | 7.5 | 99 | 164 | 16 | - | - | 33 | 0.16 | - | - | 0.85 | - | 34 | 13 | 0.22 | 198 | 19 | |
| - | 0.02 | 0.03 | 0.05 | 30 | - | - | 7.5 | - | - | - | - | - | 7.5 | 22 | - | 7.5 | 29 | |
| 0.4 | 36 | 173 | 209 | 11 | - | - | 5.0 | - | - | - | 0.20 | - | 5.2 | 26 | - | 215 | 17 | |
| 32 | 1.7 | 102 | 135 | 18 | - | - | 7.1 | 0.002 | 0.003 | - | - | - | 7.1 | 23 | 4.8 | 147 | 21 | |
| 27 | 5.8 | 22 | 55 | 24 | 439 | 2 | 68 | - | 0.04 | - | 5.7 | 0.51 | 75 | 8 | 5.9 | 575 | 8 | |
| 127 | 6.1 | 177 | 310 | 7 | 52 | 10 | 9.3 | - | 0.02 | - | 7.1 | - | 16 | 18 | 11 | 389 | 11 | |
| 49 | 31 | 173 | 253 | 9 | - | - | 47 | 5.5 | 0.2 | - | 4.9 | - | 58 | 11 | 8.6 | 319 | 12 | |
| 192 | 15 | 81 | 288 | 8 | 151 | 5 | 5.6 | - | 0.3 | - | 0.4 | - | 6.3 | 24 | 0.7 | 446 | 10 | |
| 50 | 18 | 122 | 190 | 14 | 59 | 9 | 26 | - | 2.6 | 0.02 | 32 | - | 61 | 10 | 4.3 | 314 | 13 | |
| 112 | 9.8 | 41 | 162 | 17 | 94 | 7 | 383 | - | 0.03 | - | 3.8 | 0.03 | 386 | 2 | 8.5 | 651 | 6 | |
| - | 116 | 88 | 204 | 12 | - | - | - | - | - | - | - | - | - | - | - | 204 | 18 | |
| 125 | 14 | 46 | 186 | 15 | 41 | 11 | 7.8 | - | 0.004 | - | 0.6 | - | 8.4 | 21 | 3.5 | 238 | 16 | |
| 198 | 2.8 | 39 | 239 | 10 | - | - | 12 | - | 0.2 | 0.004 | 3.9 | - | 16 | 19 | 2.2 | 257 | 15 | |
| 27 | 2.1 | 63 | 92 | 21 | 4.2 | 15 | 0.1 | - | 0.04 | - | 4.3 | - | 4.4 | 27 | 6.8 | 108 | 23 | |
| Country | Coal | Oil | Gas | sub total | rank | Nuclear | rank | Hydro | Geo Thermal | Solar PV | Solar Thermal | Wind | Tide | sub total | rank | Bio other | Total | rank |
Solar PV* is Photovoltaics
Bio other* = 198TWh (Biomass) + 69TWh (Waste) + 4TWh (other)
Environmental concerns
Variations between countries generating electrical power affect concerns about the environment. In France only 10% of electricity is generated from fossil fuels, the US is higher at 70% and China is at 80%.[12] The cleanliness of electricity depends on its source. Most scientists agree that emissions of pollutants and greenhouse gases from fossil fuel-based electricity generation account for a significant portion of world greenhouse gas emissions; in the United States, electricity generation accounts for nearly 40% of emissions, the largest of any source. Transportation emissions are close behind, contributing about one-third of U.S. production of carbon dioxide.[14]
In the United States, fossil fuel combustion for electric power generation is responsible for 65% of all emissions of sulfur dioxide, the main component of acid rain.[15] Electricity generation is the fourth highest combined source of NOx, carbon monoxide, and particulate matter in the US.[16]
In July 2011, the UK parliament tabled a motion that "levels of (carbon) emissions from nuclear power were approximately three times lower per kilowatt hour than those of solar, four times lower than clean coal and 36 times lower than conventional coal".[17]
| Technology | Description | 50th percentile (g CO2/kWhe) |
|---|---|---|
| Hydroelectric | reservoir | 4 |
| Wind | onshore | 12 |
| Nuclear | various generation II reactor types | 16 |
| Biomass | various | 18 |
| Solar thermal | parabolic trough | 22 |
| Geothermal | hot dry rock | 45 |
| Solar PV | Polycrystalline silicon | 46 |
| Natural gas | various combined cycle turbines without scrubbing | 469 |
| Coal | various generator types without scrubbing | 1001 |
See also
- Cost of electricity by source
World energy consumption: the total energy used by all of human civilization.- Distributed generation
- Electric power transmission
Cogeneration: the use of a heat engine[1] or power station to generate electricity and useful heat at the same time.
References
^ "Pearl Street Station - Engineering and Technology History Wiki". ethw.org. Retrieved 2016-08-14..mw-parser-output cite.citation{font-style:inherit}.mw-parser-output q{quotes:"""""""'""'"}.mw-parser-output code.cs1-code{color:inherit;background:inherit;border:inherit;padding:inherit}.mw-parser-output .cs1-lock-free a{background:url("//upload.wikimedia.org/wikipedia/commons/thumb/6/65/Lock-green.svg/9px-Lock-green.svg.png")no-repeat;background-position:right .1em center}.mw-parser-output .cs1-lock-limited a,.mw-parser-output .cs1-lock-registration a{background:url("//upload.wikimedia.org/wikipedia/commons/thumb/d/d6/Lock-gray-alt-2.svg/9px-Lock-gray-alt-2.svg.png")no-repeat;background-position:right .1em center}.mw-parser-output .cs1-lock-subscription a{background:url("//upload.wikimedia.org/wikipedia/commons/thumb/a/aa/Lock-red-alt-2.svg/9px-Lock-red-alt-2.svg.png")no-repeat;background-position:right .1em center}.mw-parser-output .cs1-subscription,.mw-parser-output .cs1-registration{color:#555}.mw-parser-output .cs1-subscription span,.mw-parser-output .cs1-registration span{border-bottom:1px dotted;cursor:help}.mw-parser-output .cs1-hidden-error{display:none;font-size:100%}.mw-parser-output .cs1-visible-error{font-size:100%}.mw-parser-output .cs1-subscription,.mw-parser-output .cs1-registration,.mw-parser-output .cs1-format{font-size:95%}.mw-parser-output .cs1-kern-left,.mw-parser-output .cs1-kern-wl-left{padding-left:0.2em}.mw-parser-output .cs1-kern-right,.mw-parser-output .cs1-kern-wl-right{padding-right:0.2em}
^ "Key World Energy Statistics (2018)" (PDF). International Energy Agency. 2018. p. 14.
^ "EIA - Electricity Data". www.eia.gov. Retrieved 2016-08-14.
^ DGEMP / Observatoire de l'énergie (April 2007). "L'Electricité en France en 2006 : une analyse statistique" (PDF) (in French). Retrieved 2007-05-23.
^ World's Largest Utility Battery System Installed in Alaska (press release, 2003-09-24), U.S. Department of Energy. "13,670 nickel-cadmium battery cells to generate up to 40 megawatts of power for about 7 minutes, or 27 megawatts of power for 15 minutes."
^ New World Record Achieved in Solar Cell Technology (press release, 2006-12-05), U.S. Department of Energy.
^ Smith, Karl (22 March 2013). "Will Natural Gas Stay Cheap Enough To Replace Coal And Lower Us Carbon Emissions". Forbes. Retrieved 20 June 2015.
^ "Coal & electricity". World Coal Association. Retrieved 2016-08-14.
^ http://ieeexplore.ieee.org/document/5075247/?reload=true&arnumber=5075247&queryText%3D2000%20mw%20generator&tp=
^ "OECD Factbook 2015-2016: Economic, Environmental and Social Statistics". 8 April 2016. Retrieved 12 February 2017.
^ International Energy Agency, "2008 Energy Balance for World", 2011.
^ ab IEA Statistics and Balances retrieved 2011-5-8
^ CIA World Factbook 2009 retrieved 2011-5-8
^ Borenstein, Seth (2007-06-03). "Carbon-emissions culprit? Coal". The Seattle Times. Archived from the original on 2011-04-24.
^ "Sulfur Dioxide". US Environmental Protection Agency.
^ "AirData". US Environmental Protection Agency.
^ "Early day motion 2061". UK Parliament. Retrieved 15 May 2015.
^ http://srren.ipcc-wg3.de/report/IPCC_SRREN_Annex_II.pdf
see page 10
Moomaw, W., P. Burgherr, G. Heath, M. Lenzen, J. Nyboer, A. Verbruggen, 2011: Annex II: Methodology. In IPCC
Special Report on Renewable Energy Sources and Climate Change Mitigation.
Authority control |
|
|---|


