Plymouth Devonport (UK Parliament constituency)
| Plymouth, Devonport | |
|---|---|
| Former Borough constituency for the House of Commons | |
 Boundary of Plymouth, Devonport in Devon for the 2005 general election. | |
 Location of Devon within England. | |
| County | Devon |
1832–2010 | |
| Number of members | One |
| Replaced by | Plymouth Moor View, Plymouth Sutton and Devonport |
| Created from | Devon |
Plymouth, Devonport was, from 1832 until 2010, a borough constituency represented in the House of Commons of the Parliament of the United Kingdom. It covered part of the city of Plymouth in South West England, including the former borough of Devonport.
Contents
1 History
1.1 Abolition
2 Boundaries
3 Members of Parliament
3.1 MPs 1832–1918
3.2 MPs 1918–2010
4 Elections
4.1 Elections in the 1840s
4.2 Elections in the 1850s
4.3 Elections in the 1860s
4.4 Elections in the 1870s
4.5 Elections in the 1880s
4.6 Elections in the 1890s
4.7 Elections in the 1900s
4.8 Elections in the 1910s
4.9 Elections in the 1920s
4.10 Elections in the 1930s
4.11 Elections in the 1940s
4.12 Elections in the 1950s
4.13 Elections in the 1960s
4.14 Elections in the 1970s
4.15 Elections in the 1980s
4.16 Elections in the 1990s
4.17 Elections in the 2000s
5 See also
6 Notes and references
History
The constituency was created as Devonport in 1832, and elected two members until 1918, when the number was reduced to one. Following the amalgamation of Devonport into Plymouth, the constituency was renamed as Plymouth, Devonport.
Devonport has had a number of prominent MPs, including Leslie Hore-Belisha, Michael Foot (who began his Commons career in the seat), and the former SDP leader David Owen. One of its longest serving MPs was the Conservative Dame Joan Vickers, who held the seat from 1955 until her defeat at the General Election of February 1974.
Abolition
Following a review of parliamentary representation in Devon by the Boundary Commission for England, constituencies in Plymouth have been reorganised, with both Plymouth Devonport and Plymouth Sutton being replaced by new constituencies of Plymouth Sutton and Devonport and Plymouth Moor View.[1]
Boundaries
1918-1950: The County Borough of Plymouth wards of Ford, Keyham, Molesworth, Nelson, St Aubyn, and St Budeaux.
1950-1955: The County Borough of Plymouth wards of Ford, Keyham, Molesworth, Mount Edgecumbe, Nelson, Pennycross, St Aubyn, St Budeaux, St Peter, and Stoke; and the parish of Tamerton Foliot in the Rural District of Plympton St Mary.
1955-1974: The County Borough of Plymouth wards of Drake, Ernesettle, Ford, Molesworth, Nelson, St Andrew, St Aubyn, St Budeaux, St Peter, and Stoke.
1974-1983: The County Borough of Plymouth wards of Ernesettle, Ford, St Andrew, St Aubyn, St Budeaux, St Peter, and Stoke.
1983-1997: The City of Plymouth wards of Budshead, Estover, Ham, Honicknowle, Keyham, St Budeaux, and Southway.
1997-2010: The City of Plymouth wards of Budshead, Eggbuckland, Estover, Ham, Honicknowle, Keyham, St Budeaux, and Southway.
From 1950 to 1983, the constituency included Plymouth city centre.
Members of Parliament
MPs 1832–1918
| Election | First member[2] | First party | Second member[2] | Second party | ||
|---|---|---|---|---|---|---|
1832 | Sir Edward Codrington | Whig[3][4] | Sir George Grey | Whig[3][5][6][7][8] | ||
1840 by-election | Henry Tufnell | Whig[9][10][11][3] | ||||
1847 | Sir John Romilly | Whig[12][13][11] | ||||
1852 | Sir George Berkeley | Conservative | ||||
1854 by-election | Thomas Erskine Perry | Whig[14][15] | ||||
1857 | James Wilson | Whig[16][17][18] | ||||
1859 | Liberal | Liberal | ||||
1859 by-election | Sir Michael Seymour | Liberal | ||||
1859 by-election | Sir Arthur William Buller | Liberal | ||||
1863 by-election | William Ferrand | Conservative | ||||
Jun 1865 by-election | Thomas Brassey | Liberal | ||||
Jul 1865 | John Fleming | Conservative | ||||
1866 by-election | Lord Eliot | Liberal | Montague Chambers | Liberal | ||
1868 | John Delaware Lewis | Liberal | ||||
1874 | Sir John Henry Puleston | Conservative | George Edward Price | Conservative | ||
1892 | E. J. C. Morton | Liberal | Hudson Kearley | Liberal | ||
1902 by-election | John Lockie | Conservative | ||||
1904 by-election | John Benn | Liberal | ||||
1910 (January) | Sir John Jackson | Conservative | Sir Clement Kinloch-Cooke | Conservative | ||
1918 | reduced to one seat | |||||
MPs 1918–2010
| Election | Member[2] | Party | |
|---|---|---|---|
1918 | Clement Kinloch-Cooke | Coalition Conservative | |
1922 | Conservative | ||
1923 | Leslie Hore-Belisha | Liberal | |
1931 | Liberal National | ||
| 1942 | National Independent | ||
| 1945 | Michael Foot | Labour | |
1955 | Dame Joan Vickers | Conservative | |
Feb 1974 | David Owen | Labour | |
| 1981 | Social Democrat | ||
| 1988 | Social Democrat (1988) | ||
| 1990 | Independent | ||
| 1992 | David Jamieson | Labour | |
| 2005 | Alison Seabeck | Labour | |
2010 | Constituency abolished: see Plymouth Moor View and Plymouth Sutton and Devonport | ||
Elections
Elections in the 1840s
Codrington resigned by accepting the office of Steward of the Manor of East Hendred, causing a by-election.
| Party | Candidate | Votes | % | ± | |
|---|---|---|---|---|---|
Whig | Henry Tufnell | 974 | 56.5 | N/A | |
Conservative | George Robert Dawson[20] | 750 | 43.5 | N/A | |
| Majority | 224 | 13.0 | N/A | ||
Turnout | 1,724 | 81.3 | N/A | ||
Registered electors | 2,121 | ||||
Whig hold | Swing | N/A | |||
| Party | Candidate | Votes | % | ± | |
|---|---|---|---|---|---|
Whig | Henry Tufnell | 966 | 36.1 | N/A | |
Whig | George Grey | 932 | 34.8 | N/A | |
Conservative | George Robert Dawson | 780 | 29.1 | N/A | |
| Majority | 152 | 5.7 | N/A | ||
Turnout | 1,724 | 80.9 | N/A | ||
Registered electors | 2,131 | ||||
Whig hold | Swing | N/A | |||
Whig hold | Swing | N/A | |||
Grey was appointed Home Secretary, requiring a by-election.
| Party | Candidate | Votes | % | ± | |
|---|---|---|---|---|---|
Whig | George Grey | Unopposed | |||
Whig hold | |||||
| Party | Candidate | Votes | % | ± | |
|---|---|---|---|---|---|
Whig | Henry Tufnell | 1,136 | 37.9 | +1.8 | |
Whig | John Romilly | 1,022 | 34.1 | −0.7 | |
Conservative | Joseph Sandars[21] | 842 | 28.1 | −1.0 | |
| Majority | 180 | 6.0 | +0.3 | ||
Turnout | 1,921 (est) | 82.0 (est) | +1.1 | ||
Registered electors | 2,343 | ||||
Whig hold | Swing | +1.2 | |||
Whig hold | Swing | −0.1 | |||
Romilly was appointed Solicitor General for England and Wales, requiring a by-election.
| Party | Candidate | Votes | % | ± | |
|---|---|---|---|---|---|
Whig | John Romilly | Unopposed | |||
Whig hold | |||||
Elections in the 1850s
Romilly was appointed Attorney General for England and Wales, requiring a by-election.
| Party | Candidate | Votes | % | ± | |
|---|---|---|---|---|---|
Whig | John Romilly | Unopposed | |||
Whig hold | |||||
Romilly was appointed Master of the Rolls, requiring a by-election.
| Party | Candidate | Votes | % | ± | |
|---|---|---|---|---|---|
Whig | John Romilly | Unopposed | |||
Whig hold | |||||
| Party | Candidate | Votes | % | ± | |
|---|---|---|---|---|---|
Whig | Henry Tufnell | 1,079 | 25.6 | −12.3 | |
Conservative | George Berkeley | 1,056 | 25.1 | +11.0 | |
Whig | John Romilly | 1,046 | 24.8 | −9.3 | |
Conservative | John Heron-Maxwell[22] | 1,032 | 24.5 | +10.4 | |
Turnout | 2,107 (est) | 87.5 (est) | +5.5 | ||
Registered electors | 2,407 | ||||
| Majority | 23 | 0.5 | −5.5 | ||
Whig hold | Swing | −11.5 | |||
| Majority | 10 | 0.2 | N/A | ||
Conservative gain from Whig | Swing | +10.9 | |||
Tufnell resigned, causing a by-election.
| Party | Candidate | Votes | % | ± | |
|---|---|---|---|---|---|
Whig | Thomas Erskine Perry | 1,091 | 61.3 | +10.9 | |
Conservative | John Heron-Maxwell | 689 | 38.7 | −10.9 | |
| Majority | 402 | 22.6 | +22.1 | ||
Turnout | 1,780 | 73.6 | −13.9 | ||
Registered electors | 2,417 | ||||
Whig hold | Swing | +10.9 | |||
| Party | Candidate | Votes | % | ± | |
|---|---|---|---|---|---|
Whig | Thomas Erskine Perry | Unopposed | |||
Whig | James Wilson | Unopposed | |||
Registered electors | 2,628 | ||||
Whig hold | |||||
Whig gain from Conservative | |||||
| Party | Candidate | Votes | % | ± | |
|---|---|---|---|---|---|
Liberal | James Wilson | 1,216 | 26.9 | N/A | |
Liberal | Thomas Erskine Perry | 1,198 | 26.5 | N/A | |
Conservative | William Ferrand | 1,075 | 23.7 | N/A | |
Conservative | Archibald Peel[23] | 1,039 | 22.9 | N/A | |
| Majority | 123 | 2.7 | N/A | ||
Turnout | 2,264 (est) | 82.1 (est) | N/A | ||
Registered electors | 2,759 | ||||
Liberal hold | Swing | N/A | |||
Liberal hold | Swing | N/A | |||
Wilson was appointed Vice-President of the Board of Trade, requiring a by-election.
| Party | Candidate | Votes | % | ± | |
|---|---|---|---|---|---|
Liberal | James Wilson | Unopposed | |||
Liberal hold | |||||
Perry resigned after being appointed a member of the Council of India, causing a by-election.
| Party | Candidate | Votes | % | ± | |
|---|---|---|---|---|---|
Liberal | Michael Seymour | 1,096 | 51.1 | −2.3 | |
Conservative | William Ferrand | 1,047 | 48.9 | +2.3 | |
| Majority | 49 | 2.3 | −0.4 | ||
Turnout | 2,143 | 77.7 | −4.4 | ||
Registered electors | 2,759 | ||||
Liberal hold | Swing | −2.3 | |||
Wilson resigned, causing a by-election.
| Party | Candidate | Votes | % | ± | |
|---|---|---|---|---|---|
Liberal | Arthur William Buller | 1,189 | 51.6 | −1.8 | |
Conservative | William Ferrand | 1,114 | 48.4 | +1.8 | |
| Majority | 75 | 3.3 | +0.6 | ||
Turnout | 2,303 | 83.5 | +1.4 | ||
Registered electors | 2,759 | ||||
Liberal hold | Swing | −1.8 | |||
Elections in the 1860s
Seymour resigned, causing a by-election.
| Party | Candidate | Votes | % | ± | |
|---|---|---|---|---|---|
Conservative | William Ferrand | 1,234 | 50.6 | +4.0 | |
Liberal | Frederick Grey[24] | 1,204 | 49.4 | −4.0 | |
| Majority | 30 | 1.2 | N/A | ||
Turnout | 2,438 | 88.4 | +6.3 | ||
Registered electors | 2,758 | ||||
Conservative gain from Liberal | Swing | +4.0 | |||
Buller resigned in order to contest the 1865 Liskeard by-election.
| Party | Candidate | Votes | % | ± | |
|---|---|---|---|---|---|
Liberal | Thomas Brassey | 1,264 | 51.1 | −2.3 | |
Conservative | John Fleming | 1,208 | 48.9 | +2.3 | |
| Majority | 56 | 2.3 | −0.4 | ||
Turnout | 2,472 | 87.7 | +5.6 | ||
Registered electors | 2,820 | ||||
Liberal hold | Swing | −2.3 | |||
| Party | Candidate | Votes | % | ± | |
|---|---|---|---|---|---|
Conservative | John Fleming | 1,307 | 25.5 | +2.6 | |
Conservative | William Ferrand | 1,290 | 25.2 | +1.5 | |
Liberal | Thomas Brassey | 1,279 | 25.0 | −1.9 | |
Liberal | Thomas Phinn[25] | 1,243 | 24.3 | −2.3 | |
| Majority | 11 | 0.2 | N/A | ||
Turnout | 2,560 (est) | 90.8 (est) | +8.7 | ||
Registered electors | 2,820 | ||||
Conservative gain from Liberal | Swing | +2.4 | |||
Conservative gain from Liberal | Swing | +1.8 | |||
The election was declared void on petition, on account of bribery and corrupt practices,[26] causing a by-election.
| Party | Candidate | Votes | % | ± | |
|---|---|---|---|---|---|
Liberal | William Eliot | 1,275 | 25.6 | +0.6 | |
Liberal | Montague Chambers | 1,269 | 25.5 | +1.2 | |
Conservative | Henry Cecil Raikes | 1,216 | 24.4 | −1.1 | |
Conservative | Reginald Abbot[27] | 1,215 | 24.4 | −0.8 | |
| Majority | 53 | 1.1 | N/A | ||
Turnout | 2,488 (est) | 88.2 (est) | −2.6 | ||
Registered electors | 2,820 | ||||
Liberal gain from Conservative | Swing | +0.9 | |||
Liberal gain from Conservative | Swing | +1.0 | |||
| Party | Candidate | Votes | % | ± | |
|---|---|---|---|---|---|
Liberal | John Delaware Lewis | 1,541 | 26.6 | +1.6 | |
Liberal | Montague Chambers | 1,519 | 26.2 | +1.9 | |
Conservative | William Ferrand | 1,370 | 23.6 | −1.6 | |
Conservative | William Palliser[28] | 1,365 | 23.6 | −1.9 | |
| Majority | 149 | 2.6 | N/A | ||
Turnout | 2,898 (est) | 85.9 (est) | −4.9 | ||
Registered electors | 3,374 | ||||
Liberal gain from Conservative | Swing | +1.6 | |||
Liberal gain from Conservative | Swing | +1.9 | |||
Elections in the 1870s
| Party | Candidate | Votes | % | ± | |
|---|---|---|---|---|---|
Conservative | John Henry Puleston | 1,525 | 27.3 | +3.7 | |
Conservative | George Edward Price | 1,483 | 26.6 | +3.0 | |
Liberal | John Delaware Lewis | 1,327 | 23.8 | −2.8 | |
Liberal | George William Culme Soltau-Symons[29] | 1,250 | 22.4 | −3.8 | |
| Majority | 156 | 2.8 | N/A | ||
Turnout | 2,793 (est) | 83.4 (est) | −2.5 | ||
Registered electors | 3,348 | ||||
Conservative gain from Liberal | Swing | +3.3 | |||
Conservative gain from Liberal | Swing | +3.4 | |||
Elections in the 1880s
| Party | Candidate | Votes | % | ± | |
|---|---|---|---|---|---|
Conservative | John Henry Puleston | 1,753 | 27.0 | −0.3 | |
Conservative | George Edward Price | 1,746 | 26.9 | +0.3 | |
Liberal | John Delaware Lewis | 1,509 | 23.3 | −0.5 | |
Liberal | Alexander Craig Sellar | 1,476 | 22.8 | +0.4 | |
| Majority | 237 | 3.7 | +0.9 | ||
Turnout | 3,242 (est) | 85.5 (est) | +2.1 | ||
Registered electors | 3,790 | ||||
Conservative hold | Swing | +0.1 | |||
Conservative hold | Swing | −0.1 | |||
| Party | Candidate | Votes | % | ± | |
|---|---|---|---|---|---|
Conservative | George Edward Price | 2,968 | 26.5 | −0.4 | |
Conservative | John Henry Puleston | 2,944 | 26.3 | −0.7 | |
Liberal | George Webb Medley | 2,653 | 23.7 | +0.4 | |
Liberal | Thomas Terrell | 2,635 | 23.5 | +0.7 | |
| Majority | 291 | 2.6 | −1.1 | ||
Turnout | 5,646 | 86.5 | +1.0 (est) | ||
Registered electors | 6,527 | ||||
Conservative hold | Swing | −0.6 | |||
Conservative hold | Swing | −0.6 | |||
| Party | Candidate | Votes | % | ± | |
|---|---|---|---|---|---|
Conservative | John Puleston | 2,954 | 30.2 | +3.9 | |
Conservative | George Price | 2,943 | 30.1 | +3.6 | |
Liberal | Charles W Ford[32] | 1,963 | 20.1 | −3.6 | |
Liberal | Herbert Lionel Showers | 1,918 | 19.6 | −3.9 | |
| Majority | 980 | 10.0 | +7.4 | ||
Turnout | 4,936 | 75.6 | −10.9 | ||
Registered electors | 6,527 | ||||
Conservative hold | Swing | +3.8 | |||
Conservative hold | Swing | +3.8 | |||
Elections in the 1890s

Kearley
| Party | Candidate | Votes | % | ± | |
|---|---|---|---|---|---|
Liberal | Hudson Kearley | 3,354 | 26.4 | +6.3 | |
Liberal | E. J. C. Morton | 3,325 | 26.3 | +6.7 | |
Conservative | George Price | 3,012 | 23.8 | −6.3 | |
Conservative | Robert Harvey | 2,972 | 23.5 | −6.7 | |
| Majority | 313 | 2.5 | N/A | ||
Turnout | 6,378 (est) | 83.6 | +8.0 | ||
Registered electors | 7,629 | ||||
Liberal gain from Conservative | Swing | +6.3 | |||
Liberal gain from Conservative | Swing | +6.7 | |||

Morton
| Party | Candidate | Votes | % | ± | |
|---|---|---|---|---|---|
Liberal | Hudson Kearley | 3,570 | 26.2 | −0.2 | |
Liberal | E. J. C. Morton | 3,511 | 25.7 | −0.6 | |
Conservative | Pridham Henry Pridham Whippell | 3,303 | 24.2 | +0.4 | |
Conservative | TU Thynne | 3,263 | 23.9 | +0.4 | |
| Majority | 208 | 1.5 | −1.0 | ||
Turnout | 6,875 (est) | 86.9 | +3.3 | ||
Registered electors | 7,911 | ||||
Liberal hold | Swing | −0.3 | |||
Liberal hold | Swing | −0.5 | |||
Elections in the 1900s
| Party | Candidate | Votes | % | ± | |
|---|---|---|---|---|---|
Liberal | Hudson Kearley | 3,626 | 25.9 | −0.3 | |
Liberal | E. J. C. Morton | 3,538 | 25.2 | −0.5 | |
Conservative | John Lockie | 3,458 | 24.7 | +0.5 | |
Conservative | F McCormick Goodheart | 3,394 | 24.2 | +0.3 | |
| Majority | 80 | 0.5 | −1.0 | ||
Turnout | 85.1 | −1.8 | |||
Registered electors | 8,351 | ||||
Liberal hold | Swing | −0.4 | |||
Liberal hold | Swing | −0.4 | |||
| Party | Candidate | Votes | % | ± | |
|---|---|---|---|---|---|
Conservative | John Lockie | 3,785 | 50.2 | +1.3 | |
Liberal | Thomas Brassey | 3,757 | 49.8 | −1.3 | |
| Majority | 28 | 0.4 | N/A | ||
Turnout | 7,542 | 84.3 | −0.8 | ||
Registered electors | 8,946 | ||||
Conservative gain from Liberal | Swing | +1.3 | |||

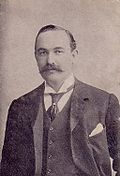
John Benn
| Party | Candidate | Votes | % | ± | |
|---|---|---|---|---|---|
Liberal | John Benn | 6,219 | 54.6 | +3.5 | |
Conservative | John Jackson | 5,179 | 45.4 | −3.5 | |
| Majority | 1,040 | 9.2 | +8.7 | ||
Turnout | 11,398 | 79.3 | −5.8 | ||
Registered electors | 14,379 | ||||
Liberal hold | Swing | +3.5 | |||
| Party | Candidate | Votes | % | ± | |
|---|---|---|---|---|---|
Liberal | Hudson Kearley | 6,923 | 29.1 | +3.2 | |
Liberal | John Benn | 6,527 | 27.5 | +2.3 | |
Conservative | John Jackson | 5,239 | 22.0 | −2.7 | |
Conservative | F Holme-Summer | 5,080 | 21.4 | −2.8 | |
| Majority | 1,288 | 5.5 | +5.0 | ||
Turnout | 81.4 | −3.7 | |||
Registered electors | 14,978 | ||||
Liberal hold | Swing | +3.0 | |||
Liberal hold | Swing | +2.5 | |||
Elections in the 1910s
| Party | Candidate | Votes | % | ± | |
|---|---|---|---|---|---|
Conservative | John Jackson | 5,658 | 26.7 | +4.7 | |
Conservative | Clement Kinloch-Cooke | 5,286 | 24.9 | +3.5 | |
Liberal | John Benn | 5,146 | 24.2 | −3.3 | |
Liberal | Samuel Lithgow[36] | 5,140 | 24.2 | −4.9 | |
| Majority | 140 | 0.7 | N/A | ||
Turnout | 89.2 | +7.8 | |||
Registered electors | 12,125 | ||||
Conservative gain from Liberal | Swing | +4.0 | |||
Conservative gain from Liberal | Swing | +4.2 | |||
Godfrey Baring
| Party | Candidate | Votes | % | ± | |
|---|---|---|---|---|---|
Conservative | John Jackson | 5,170 | 26.0 | −0.7 | |
Conservative | Clement Kinloch-Cooke | 5,111 | 25.7 | +0.8 | |
Liberal | Samuel Lithgow | 4,841 | 24.3 | +0.1 | |
Liberal | Godfrey Baring | 4,782 | 24.0 | −0.2 | |
| Majority | 270 | 1.4 | +0.7 | ||
Turnout | 83.0 | −6.2 | |||
Registered electors | 12,125 | ||||
Conservative hold | Swing | −0.4 | |||
Conservative hold | Swing | +0.5 | |||
General Election 1914/15:
Another General Election was required to take place before the end of 1915. The political parties had been making preparations for an election to take place and by the July 1914, the following candidates had been selected;
Unionist: Clement Kinloch-Cooke, John Jackson
Liberal: Samuel Lithgow
Labour:
| Party | Candidate | Votes | % | ± | |
|---|---|---|---|---|---|
C | Unionist | Clement Kinloch-Cooke | 13,240 | 62.2 | +10.5 |
Labour | Fred Bramley | 4,115 | 19.3 | N/A | |
Liberal | Samuel Lithgow | 3,930 | 18.5 | −19.8 | |
| Majority | 9,125 | 42.9 | +41.5 | ||
Turnout | 21,285 | 67.2 | −15.8 | ||
Unionist hold | Swing | +15.2 | |||
C indicates candidate endorsed by the coalition government. | |||||
Elections in the 1920s
| Party | Candidate | Votes | % | ± | |
|---|---|---|---|---|---|
Unionist | Clement Kinloch-Cooke | 10,459 | 42.3 | ||
Liberal | Leslie Hore-Belisha | 8,538 | 34.5 | ||
Labour | Barrington Bates | 5,742 | 23.2 | ||
| Majority | 1,921 | 7.8 | |||
Turnout | 79.1 | ||||
Unionist hold | Swing | ||||
| Party | Candidate | Votes | % | ± | |
|---|---|---|---|---|---|
Liberal | Leslie Hore-Belisha | 12,269 | 45.7 | +11.2 | |
Unionist | Clement Kinloch-Cooke | 10,428 | 38.8 | -3.5 | |
Labour | Joseph Harris | 4,158 | 15.5 | -7.7 | |
| Majority | 1,841 | 6.9 | -0.9 | ||
Turnout | 82.7 | +3.6 | |||
Liberal gain from Unionist | Swing | +7.3 | |||
| Party | Candidate | Votes | % | ± | |
|---|---|---|---|---|---|
Liberal | Leslie Hore-Belisha | 11,115 | 39.7 | ||
Unionist | Samuel Gluckstein | 10,534 | 37.6 | ||
Labour | Holford Knight | 6,350 | 22.7 | ||
| Majority | 581 | 2.1 | -4.8 | ||
Turnout | 84.4 | ||||
Liberal hold | Swing | -2.4 | |||
| Party | Candidate | Votes | % | ± | |
|---|---|---|---|---|---|
Liberal | Leslie Hore-Belisha | 15,233 | 45.7 | +6.0 | |
Unionist | Samuel Gluckstein | 10,688 | 32.0 | -5.6 | |
Labour | Donald Beaton Fraser | 7,428 | 22.3 | -0.4 | |
| Majority | 4,545 | 13.7 | +11.6 | ||
Turnout | 82.3 | -2.1 | |||
Liberal hold | Swing | +5.8 | |||
Elections in the 1930s
| Party | Candidate | Votes | % | ± | |
|---|---|---|---|---|---|
Liberal National | Leslie Hore-Belisha | 23,459 | 72.19 | ||
Labour | Paul Reed | 9,039 | 27.81 | ||
| Majority | 14,420 | 44.37 | |||
Turnout | 78.18 | ||||
Liberal National hold | Swing | ||||
| Party | Candidate | Votes | % | ± | |
|---|---|---|---|---|---|
Liberal National | Leslie Hore-Belisha | 20,852 | 68.13 | ||
Labour | John Brown | 9,756 | 31.87 | ||
| Majority | 11,096 | 36.25 | |||
Turnout | 72.27 | ||||
Liberal National hold | Swing | ||||
General Election 1939/40:
Another General Election was required to take place before the end of 1940. The political parties had been making preparations for an election to take place from 1939 and by the end of this year, the following candidates had been selected;
Liberal National: Leslie Hore-Belisha
Labour: Michael Foot
Elections in the 1940s
| Party | Candidate | Votes | % | ± | |
|---|---|---|---|---|---|
Labour | Michael Foot | 13,395 | 54.06 | ||
National | Leslie Hore-Belisha | 11,382 | 45.94 | ||
| Majority | 2,013 | 8.12 | |||
Turnout | 71.11 | ||||
Labour gain from Liberal National | Swing | ||||
Elections in the 1950s
| Party | Candidate | Votes | % | ± | |
|---|---|---|---|---|---|
Labour | Michael Foot | 30,812 | 50.59 | ||
Conservative and National Liberal | Randolph Churchill | 27,329 | 44.87 | ||
Liberal | Alfred Charles Cann | 2,766 | 4.54 | ||
| Majority | 3,483 | 5.72 | |||
Turnout | 87.16 | ||||
Labour hold | Swing | ||||
| Party | Candidate | Votes | % | ± | |
|---|---|---|---|---|---|
Labour | Michael Foot | 32,158 | 51.93 | ||
Conservative and National Liberal | Randolph Churchill | 29,768 | 48.07 | ||
| Majority | 2,390 | 3.86 | |||
Turnout | 85.28 | ||||
Labour hold | Swing | ||||
| Party | Candidate | Votes | % | ± | |
|---|---|---|---|---|---|
Conservative and National Liberal | Joan Vickers | 24,821 | 47.15 | ||
Labour | Michael Foot | 24,721 | 46.96 | ||
Liberal | Arthur Russell Mayne | 3,100 | 5.89 | ||
| Majority | 100 | 0.19 | |||
Turnout | 77.15 | ||||
Conservative and National Liberal gain from Labour | Swing | ||||
| Party | Candidate | Votes | % | ± | |
|---|---|---|---|---|---|
Conservative and National Liberal | Joan Vickers | 28,481 | 56.39 | ||
Labour | Michael Foot | 22,027 | 43.61 | ||
| Majority | 6,454 | 12.78 | |||
Turnout | 78.63 | ||||
Conservative and National Liberal hold | Swing | ||||
Elections in the 1960s
| Party | Candidate | Votes | % | ± | |
|---|---|---|---|---|---|
Conservative | Joan Vickers | 24,241 | 54.04 | ||
Labour | Rowland Edward Crabb | 20,615 | 45.96 | ||
| Majority | 3,626 | 8.08 | |||
Turnout | 73.58 | ||||
Conservative hold | Swing | ||||
| Party | Candidate | Votes | % | ± | |
|---|---|---|---|---|---|
Conservative | Joan Vickers | 22,760 | 50.35 | ||
Labour | Rowland Edward Crabb | 22,441 | 49.65 | ||
| Majority | 319 | 0.71 | |||
Turnout | 76.21 | ||||
Conservative hold | Swing | ||||
Elections in the 1970s
| Party | Candidate | Votes | % | ± | |
|---|---|---|---|---|---|
Conservative | Joan Vickers | 21,843 | 51.62 | ||
Labour | F Keith Taylor | 20,471 | 48.38 | ||
| Majority | 1,372 | 3.24 | |||
Turnout | 70.95 | ||||
Conservative hold | Swing | ||||
| Party | Candidate | Votes | % | ± | |
|---|---|---|---|---|---|
Labour | David Owen | 15,819 | 42.2 | ||
Conservative | Joan Vickers | 15,382 | 41.0 | ||
Liberal | N E Westbrook | 6,298 | 16.8 | ||
| Majority | 437 | 1.2 | |||
Turnout | 75.3 | ||||
Labour gain from Conservative | Swing | ||||
| Party | Candidate | Votes | % | ± | |
|---|---|---|---|---|---|
Labour | David Owen | 17,398 | 47.3 | +5.1 | |
Conservative | Joan Vickers | 15,139 | 41.1 | +0.1 | |
Liberal | N E Westbrook | 3,953 | 10.7 | -6.1 | |
Independent Liberal | J N Hill | 312 | 0.9 | N/A | |
| Majority | 2,259 | 6.1 | |||
Turnout | 73.5 | -1.8 | |||
Labour hold | Swing | ||||
| Party | Candidate | Votes | % | ± | |
|---|---|---|---|---|---|
Labour | David Owen | 16,545 | 47.4 | +0.1 | |
Conservative | Kenneth William Hughes | 15,544 | 44.6 | +3.5 | |
Liberal | Michael James | 2,360 | 6.8 | −3.9 | |
National Front | Leonard Arthur Bearsford-Walker | 243 | 0.7 | N/A | |
Independent | Richard Hilton Stoner | 203 | 0.6 | N/A | |
| Majority | 1,001 | 2.9 | |||
Turnout | 34,895 | 72.3 | −1.2 | ||
Labour hold | Swing | ||||
Elections in the 1980s
| Party | Candidate | Votes | % | ± | |
|---|---|---|---|---|---|
Social Democratic | David Owen | 20,843 | 44.3 | ||
Conservative | Ann Widdecombe | 15,907 | 33.8 | ||
Labour | Julian Priestley | 9,845 | 21.0 | ||
Ind. Conservative | James Sullivan | 292 | 0.6 | ||
BNP | Robert Bearsford-Walker | 72 | 0.2 | ||
| Christian Democrat | Faith Hill | 51 | 0.1 | ||
| Majority | 4,936 | 10.5 | |||
Turnout | 47,010 | 76.1 | |||
Social Democratic gain from Labour | Swing | ||||
- This constituency underwent boundary changes between the 1979 and 1983 general elections and thus calculation of change in vote share is not meaningful.
| Party | Candidate | Votes | % | ± | |
|---|---|---|---|---|---|
Social Democratic | David Owen | 21,039 | 42.3 | −2.0 | |
Conservative | Tom Jones | 14,569 | 29.3 | −4.5 | |
Labour | Ian Flintoff | 14,166 | 28.4 | +7.4 | |
| Majority | 6,470 | 13.0 | |||
Turnout | 49,774 | 77.2 | |||
Social Democratic hold | Swing | ||||
Elections in the 1990s
| Party | Candidate | Votes | % | ± | |
|---|---|---|---|---|---|
Labour | David Jamieson | 24,953 | 48.7 | +20.3 | |
Conservative | Keith Simpson | 17,541 | 34.3 | +5.0 | |
Liberal Democrat | Murdoch MacTaggart | 6,315 | 12.3 | −30.0 | |
SDP | Harold Luscombe | 2,152 | 4.2 | −38.1 | |
Natural Law | Francis Lyons | 255 | 0.5 | N/A | |
| Majority | 7,412 | 14.4 | +1.4 | ||
Turnout | 51,216 | 77.8 | +0.6 | ||
Labour gain from Social Democratic | Swing | +7.7 | |||
| Party | Candidate | Votes | % | ± | |
|---|---|---|---|---|---|
Labour | David Jamieson | 31,629 | 60.9 | +13.8 | |
Conservative | Anthony Johnson | 12,562 | 24.2 | −11.4 | |
Liberal Democrat | Richard Corpus | 5,570 | 10.7 | −2.5 | |
Referendum | Clive Norsworthy | 1,486 | 2.9 | N/A | |
UKIP | Caroline Farrand | 478 | 0.9 | N/A | |
National Democrats | Stephen Ebbs | 238 | 0.4 | N/A | |
| Majority | 19,067 | 36.7 | |||
Turnout | 51,963 | 69.8 | |||
Labour hold | Swing | +12.6 | |||
This constituency underwent boundary changes between the 1992 and 1997 general elections and thus change in share of vote is based on a notional calculation.
Elections in the 2000s
| Party | Candidate | Votes | % | ± | |
|---|---|---|---|---|---|
Labour | David Jamieson | 24,322 | 58.3 | −2.6 | |
Conservative | John Glen | 11,289 | 27.1 | +2.9 | |
Liberal Democrat | Keith Baldry | 4,513 | 10.8 | +0.1 | |
UKIP | Michael Parker | 958 | 2.3 | +1.4 | |
Socialist Alliance | Tony Staunton | 334 | 0.8 | N/A | |
Socialist Labour | Rob Hawkins | 303 | 0.7 | N/A | |
| Majority | 13,033 | 31.2 | |||
Turnout | 41,719 | 56.6 | −13.1 | ||
Labour hold | Swing | −2.7 | |||
| Party | Candidate | Votes | % | ± | |
|---|---|---|---|---|---|
Labour | Alison Seabeck | 18,612 | 44.3 | −14.0 | |
Conservative | Richard Cuming | 10,509 | 25.0 | −2.1 | |
Liberal Democrat | Judith Jolly | 8,000 | 19.1 | +8.3 | |
UKIP | Bill Wakeham | 3,324 | 7.9 | +5.6 | |
Independent | Keith Greene | 747 | 1.8 | N/A | |
Socialist Labour | Rob Hawkins | 445 | 1.1 | +0.4 | |
Respect | Tony Staunton | 376 | 0.9 | N/A | |
| Majority | 8,101 | 19.3 | |||
Turnout | 41,982 | 57.6 | +1.0 | ||
Labour hold | Swing | −6.0 | |||
See also
- List of Parliamentary constituencies in Devon
Notes and references
^ "Final recommendations for Parliamentary constituencies in the counties of Devon, Plymouth and Torbay". Boundary Commission for England. 24 November 2004. Archived from the original on 2 November 2009. Retrieved 25 April 2010..mw-parser-output cite.citation{font-style:inherit}.mw-parser-output .citation q{quotes:"""""""'""'"}.mw-parser-output .citation .cs1-lock-free a{background:url("//upload.wikimedia.org/wikipedia/commons/thumb/6/65/Lock-green.svg/9px-Lock-green.svg.png")no-repeat;background-position:right .1em center}.mw-parser-output .citation .cs1-lock-limited a,.mw-parser-output .citation .cs1-lock-registration a{background:url("//upload.wikimedia.org/wikipedia/commons/thumb/d/d6/Lock-gray-alt-2.svg/9px-Lock-gray-alt-2.svg.png")no-repeat;background-position:right .1em center}.mw-parser-output .citation .cs1-lock-subscription a{background:url("//upload.wikimedia.org/wikipedia/commons/thumb/a/aa/Lock-red-alt-2.svg/9px-Lock-red-alt-2.svg.png")no-repeat;background-position:right .1em center}.mw-parser-output .cs1-subscription,.mw-parser-output .cs1-registration{color:#555}.mw-parser-output .cs1-subscription span,.mw-parser-output .cs1-registration span{border-bottom:1px dotted;cursor:help}.mw-parser-output .cs1-ws-icon a{background:url("//upload.wikimedia.org/wikipedia/commons/thumb/4/4c/Wikisource-logo.svg/12px-Wikisource-logo.svg.png")no-repeat;background-position:right .1em center}.mw-parser-output code.cs1-code{color:inherit;background:inherit;border:inherit;padding:inherit}.mw-parser-output .cs1-hidden-error{display:none;font-size:100%}.mw-parser-output .cs1-visible-error{font-size:100%}.mw-parser-output .cs1-maint{display:none;color:#33aa33;margin-left:0.3em}.mw-parser-output .cs1-subscription,.mw-parser-output .cs1-registration,.mw-parser-output .cs1-format{font-size:95%}.mw-parser-output .cs1-kern-left,.mw-parser-output .cs1-kern-wl-left{padding-left:0.2em}.mw-parser-output .cs1-kern-right,.mw-parser-output .cs1-kern-wl-right{padding-right:0.2em}
^ abc Leigh Rayment's Historical List of MPs – Constituencies beginning with "D" (part 2)
^ abcde Stooks Smith, Henry. (1973) [1844-1850]. Craig, F. W. S., ed. The Parliaments of England (2nd ed.). Chichester: Parliamentary Research Services. pp. 68–69. ISBN 0-900178-13-2.
^ One of No Party (1836). Random Recollections of the House of Commons from the Year 1830 to the Close of 1835, Including Personal Sketches of the Leading Members of All Parties. Philadelphia: E. L. Carey & A. Hart. pp. 158–159. Retrieved 2 November 2018 – via Google Books.
^ Creighton, Mandell (1890). . In Stephen, Leslie; Lee, Sidney. Dictionary of National Biography. 23. London: Smith, Elder & Co.
^ Crosby's Parliamentary Record of Elections in Great Britain and Ireland. Leeds: George Crosby. 1847. p. 122. Retrieved 28 May 2018 – via Google Books.
^ "The Age". Melbourne, Victoria. 13 September 1882. p. 4. Retrieved 28 May 2018.
^ "The Excluded Whigs". Leeds Intelligencer. 22 January 1853. p. 3. Retrieved 28 May 2018 – via British Newspaper Archive. (Subscription required (help)).
^ "Postscript". The Spectator. 9 November 1839. p. 9. Retrieved 6 May 2018.
^ The Spectator, Volume 14. F.C. Westley. 1841. p. 653. Retrieved 6 May 2018.
^ ab Gash, Norman (2013). Politics in the Age of Peel: A Study in the Technique of Parliamentary Representation, 1830–1850. Faber & Faber. pp. 355, 440. ISBN 9780571302901. Retrieved 6 May 2018.
^ "Political". Durham Chronicle. 13 March 1846. p. 4. Retrieved 19 April 2018 – via British Newspaper Archive. (Subscription required (help)).
^ "Bridport Election". Nottingham Review and General Advertiser for the Midland Counties. 13 March 1846. p. 8. Retrieved 19 April 2018 – via British Newspaper Archive. (Subscription required (help)).
^ Atkinson, Diane (2012). The Criminal Conversation of Mrs Norton. London: Arrow Books. p. 390. ISBN 9780099556480. Retrieved 6 May 2018.
^ Stubbings, Matthew (October 2016). "British Conservatism and the Indian Revolt: The Annexation of Awadh and the Consequences of Liberal Empire, 1856–1858". Journal of British Studies. 55 (4): 728–749. doi:10.1017/jbr.2016.73. Retrieved 6 May 2018.
^ "The General Election". Morning Post. 24 July 1847. p. 3. Retrieved 6 May 2018 – via British Newspaper Archive. (Subscription required (help)).
^ Rosser, Alexander S. (2009). "Businessmen in the House of Commons: A Comparative Study of the 1852–1857 and the 1895–1900 Parliaments". KU Scholar Works. University of Kansas. p. 65. Retrieved 6 May 2018.
^ Roberts, F. David (2002). The Social Conscience of the Early Victorians. Stanford: Stanford University Press. p. 123. ISBN 9780804780933. Retrieved 6 May 2018.
^ abcdefghijklmnopqrstu Craig, F. W. S., ed. (1977). British Parliamentary Election Results 1832-1885 (1st ed.). London: Macmillan Press. ISBN 978-1-349-02349-3.
^ "Cumberland Pacquet, and Ware's Whitehaven Advertiser". 28 January 1840. p. 3. Retrieved 2 November 2018 – via British Newspaper Archive. (Subscription required (help)).
^ "The Elections". London Daily News. 31 July 1847. pp. 2–3. Retrieved 2 November 2018 – via British Newspaper Archive. (Subscription required (help)).
^ "Devonport". Bristol Times and Mirror. 10 July 1852. p. 2. Retrieved 6 May 2018 – via British Newspaper Archive. (Subscription required (help)).
^ "Election Intelligence". London Evening Standard. 20 April 1859. p. 6. Retrieved 6 May 2018 – via British Newspaper Archive. (Subscription required (help)).
^ "Declaration of the Poll". Western Times. 14 February 1863. p. 2. Retrieved 7 February 2018 – via British Newspaper Archive. (Subscription required (help)).
^ "Devonport". Shipping and Mercantile Gazette. 19 June 1865. pp. 7–8. Retrieved 7 February 2018 – via British Newspaper Archive. (Subscription required (help)).
^ "Election Petitions". Leicester Mail. 17 March 1866. pp. 2–3. Retrieved 7 February 2018 – via British Newspaper Archive. (Subscription required (help)).
^ "Mr Raikes Beaten at Devonport". Cheshire Observer. 26 May 1866. p. 8. Retrieved 7 February 2018 – via British Newspaper Archive. (Subscription required (help)).
^ "Election News". Preston Herald. 3 October 1868. p. 6. Retrieved 7 February 2018 – via British Newspaper Archive. (Subscription required (help)).
^ "Devonport". Western Daily Mercury. 2 February 1874. p. 5. Retrieved 29 December 2017 – via British Newspaper Archive. (Subscription required (help)).
^ abcdefgh The Liberal Year Book, 1907
^ abcdefgh British Parliamentary Election Results, 1885-1918 FWS Craig
^ "District News". Sheffield Independent. 22 Dec 1886. p. 4. Retrieved 25 November 2017 – via British Newspaper Archive. (Subscription required (help)).
^ ab Debrett's House of Commons & Judicial Bench, 1901
^ ab British parliamentary election results 1885–1918 by Craig
^ Debrett's House of Commons & Judicial Bench, 1916
^ ‘LITHGOW, Samuel’, Who Was Who, A & C Black, an imprint of Bloomsbury Publishing plc, 1920–2016; online edn, Oxford University Press, 2014 ; online edn, April 2014 accessed 18 Sept 2017
^ Debrett's House of Commons & Judicial Bench, 1916
^ [1]
^ [2]
^ [3]
^ [4]
^ abc Election results, 1974 – 1979
^ "Election Data 1983". Electoral Calculus. Archived from the original on 15 October 2011. Retrieved 18 October 2015.
^ abc Election results, 1983 – 1992
^ "Election Data 1987". Electoral Calculus. Archived from the original on 15 October 2011. Retrieved 18 October 2015.
^ "Election Data 1992". Electoral Calculus. Archived from the original on 15 October 2011. Retrieved 18 October 2015.
^ "Politics Resources". Election 1992. Politics Resources. 9 April 1992. Retrieved 6 December 2010.
^ "Election Data 1997". Electoral Calculus. Archived from the original on 15 October 2011. Retrieved 18 October 2015.
^ ab Election results, 1997 – 2001
^ "Election Data 2001". Electoral Calculus. Archived from the original on 15 October 2011. Retrieved 18 October 2015.
^ "Election Data 2005". Electoral Calculus. Archived from the original on 15 October 2011. Retrieved 18 October 2015.
^ Election result, 2005
Craig, F. W. S. (1983). British parliamentary election results 1918–1949 (3 ed.). Chichester: Parliamentary Research Services. ISBN 0-900178-06-X.
Coordinates: 50°25′N 4°08′W / 50.41°N 4.14°W / 50.41; -4.14


