Washington metropolitan area
Washington metropolitan area (Washington – Arlington – Alexandria) | |
|---|---|
Metropolitan area | |
   Old Town in Alexandria, Virginia; Rosslyn in Arlington County, Virginia; National Mall in Washington, D.C. | |
| Nickname(s): DMV[1][2](D.C., Maryland, Virginia) | |
 Calvert Charles Frederick Howard Montgomery Prince George's Alexandria Arlington Clarke Fairfax Fairfax County Falls Church Fauquier Loudoun Manassas Manassas Park Prince William Spotsylvania Stafford Fredericksburg Warren Washington Jefferson | |
| Country | |
| U.S. state/federal district | |
| Principal municipalities | Washington, Alexandria |
| Area (2010) | |
| • Urban | 1,407.0 sq mi (3,644.2 km2) |
| • Metro | 5,564.6 sq mi (14,412 km2) |
| Elevation | 0–2,350 ft (0–716 m) |
| Population (2016)[3][4][5] | |
| • Metropolitan area | 6,133,552 (6th) |
| • Density | 1,084/sq mi (418.7/km2) |
| • Urban | 4,586,770 (8th) |
| • CSA (2010) | 9,546,579 (4th) |
| Time zone | UTC-5 (ET) |
| • Summer (DST) | UTC-4 (EST) |
The Washington metropolitan area is the metropolitan area centered on Washington, D.C., the capital of the United States. The area includes all of the federal district and parts of the U.S. states of Maryland and Virginia, along with a small portion of West Virginia. While not a part of the Washington metropolitan area, St. Mary's County is part of the Baltimore–Washington metropolitan area.
The Washington metropolitan area is one of the most educated and most affluent metropolitan areas in the US.[6] The metro area anchors the southern end of the densely populated Northeast megalopolis with an estimated total population of 6,216,589 as of the 2017 U.S. Census Bureau estimate[update],[7] making it the sixth-largest metropolitan area in the nation[8] and the largest metropolitan area in the Census Bureau's South Atlantic division.[9]
Contents
1 Nomenclature
2 Composition
2.1 Political subdivisions
2.1.1 District of Columbia
2.1.2 Maryland
2.1.3 Virginia
2.1.4 West Virginia
3 Regional organizations
3.1 Metropolitan Washington Council of Governments
4 Principal cities
5 Demographics
5.1 Politics
5.2 Racial composition
5.2.1 2016 American Community Survey
5.2.2 2010 U.S. Census
5.2.3 2006
5.2.4 1980
5.3 Social indicators
6 Economy
6.1 Real estate and housing market
6.2 Net worth, wealth disparities, and business ownership
6.3 Primary industries
6.4 Largest companies
6.5 History
7 Transportation
7.1 Major airports
7.2 Rail transit systems
7.3 Bus transit systems
7.4 Major roads
7.5 Bicycle sharing
8 Culture
8.1 Sports teams
8.2 Media
9 Area codes
10 Sister cities
11 See also
12 References
13 External links
Nomenclature
The U.S. Office of Management and Budget defines the area as the Washington–Arlington–Alexandria, DC–VA–MD–WV metropolitan statistical area, a metropolitan statistical area used for statistical purposes by the United States Census Bureau and other agencies. The region's three largest cities are the federal territory of Washington, D.C., the county (and census-designated place) of Arlington, and the independent city of Alexandria. The Office of Management and Budget also includes the metropolitan statistical area as part of the larger Baltimore–Washington metropolitan area, which has a population of 9,546,579 as of the 2014 Census Estimate.[10]
The area is also sometimes referred to as the National Capital Region, particularly by federal agencies such as the military[11] and Department of Homeland Security.[12] Another term used to describe the region is the D.C. Area. The area in the region that is surrounded by Interstate 495 is also referred to as being "inside the Beltway". The city of Washington, which is at the center of the area, is referred to as "the District" because it is the federal District of Columbia, and is not part of any state. The Virginian portion of the region is known as Northern Virginia.
Composition

Satellite photo of the Washington metropolitan area

Map highlighting labor patterns of regional counties
The U.S. Census Bureau divides the Washington statistical metropolitan area into two metropolitan divisions:[13]
- Washington–Arlington–Alexandria, DC–VA–MD–WV Metropolitan Division, comprising the majority of the metropolitan area
- Silver Spring–Frederick–Rockville, MD Metropolitan Division, consisting of Montgomery and Frederick counties
Political subdivisions
The area includes the following counties, districts, and independent cities:[13]
District of Columbia
- Washington
Maryland
- Calvert County
- Charles County
- Frederick County
- Montgomery County
- Prince George's County
Virginia
- Alexandria
- Arlington County
- Clarke County
- Culpeper County
- Fairfax County
- Fairfax
- Falls Church
- Fauquier County
- Fredericksburg
- Loudoun County
- Manassas
- Manassas Park
- Prince William County
- Rappahannock County
- Spotsylvania County
- Stafford County
- Warren County
West Virginia
- Jefferson County
| Historical populations - Washington Metropolitan Area | |||
|---|---|---|---|
| Census | Pop. | %± | |
| 1950 | 1,464,089 | — | |
| 1960 | 2,001,897 | 36.7% | |
| 1970 | 2,861,123 | 42.9% | |
| 1980 | 3,060,922 | 7.0% | |
| 1990 | 3,923,574 | 28.2% | |
| 2000 | 4,923,153 | 25.5% | |
| 2010 | 5,636,232 | 14.5% | |
U.S. Decennial Census 2011 estimate | |||
Regional organizations
Metropolitan Washington Council of Governments
Founded in 1957, the Metropolitan Washington Council of Governments (MWCOG) is a regional organization of 21 Washington-area local governments, as well as area members of the Maryland and Virginia state legislatures, the U.S. Senate, and the U.S. House of Representatives. MWCOG provides a forum for discussion and the development of regional responses to issues regarding the environment, transportation, public safety, homeland security, affordable housing, community planning, and economic development.[14]
The National Capital Region Transportation Planning Board, a component of MWCOG, is the federally designated metropolitan planning organization for the metropolitan Washington area.[15]
Principal cities

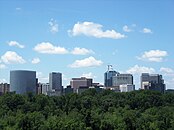
View of downtown Washington, with the skylines of Arlington and Tysons Corner in the distance.
The metropolitan area includes the following principal cities (not all of which are incorporated as cities; one, Arlington, is actually a county, and Bethesda, Reston, and Silver Spring are unincorporated CDPs.)[16]
- Washington, D.C.
- Arlington, Virginia
- Alexandria, Virginia
- Bethesda, Maryland
- Fairfax, Virginia
- Frederick, Maryland
- Gaithersburg, Maryland
- Reston, Virginia
- Rockville, Maryland
- Silver Spring, Maryland
Demographics
| Year | DEM | GOP | Others |
|---|---|---|---|
2016 | 69.0% 1,860,678 | 25.7% 692,743 | 5.4% 145,269 |
2012 | 67.5% 1,813,963 | 30.9% 829,567 | 1.7% 44,708 |
2008 | 68.0% 1,603,902 | 31.0% 728,916 | 1.0% 25,288 |
2004 | 61.0% 1,258,743 | 38.0% 785,144 | 1.4% 19,735 |
2000 | 58.5% 1,023,089 | 37.9% 663,590 | 3.6% 62,437 |
1996 | 57.0% 861,881 | 37.0% 558,830 | 6.0% 89,259 |
1992 | 53.0% 859,889 | 34.1% 553.369 | 12.9% 209,651 |
1988 | 50.4% 684,453 | 48.6% 659,344 | 1.0% 14,219 |
1984 | 51.0% 653,568 | 48.5% 621,377 | 0.4% 5,656 |
1980 | 44.7% 484,590 | 44.6% 482,506 | 11.1% 115,797 |
1976 | 54.2% 590,481 | 44.9% 488,995 | 1.0% 10,654 |
1972 | 44.2% 431,257 | 54.8% 534,235 | 1.1% 10,825 |
1968 | 49.4% 414,345 | 39.1% 327,662 | 11.5% 96,701 |
1964 | 69.8% 495,490 | 30.2% 214,293 | 0.1% 462 |
1960 | 52.5% 204,614 | 47.3% 184,499 | 0.1% 593 |

The southern portion of the Capital Beltway along the Potomac River, featuring portions of Washington, D.C., Maryland, and Virginia.
Old Town Alexandria, Joint Base Anacostia-Bolling, and National Harbor, Maryland are visible.
Politics
The relative strength of the major political parties within the region is shown by the presidential election results since 1960, as presented in the adjacent table.[citation needed]
Racial composition
The area has been a magnet for international immigration since the late 1960s. It is also a magnet for internal migration (persons moving from one region of the U.S. to another).[17][dubious ]
Racial composition of the Washington, D.C. area:
2016 American Community Survey
- Non-Hispanic White : 45.8%
- Black or African American : 24.9%
- Hispanic or Latino : 15.5%
- Asian : 10.0%
- Mixed and Other : 3.8%
Hispanic Origin
Asian Origin
5.2% Salvadoran
2.7% Indian
2.3% Mexican
1.8% Chinese
1.2% Honduran
1.3% Korean
1.1% Guatemalan
1.2% Vietnamese
0.9% Puerto Rican
1.0% Filipino
0.8% Peruvian
0.5% Pakistani
0.7% Bolivian
0.2% Japanese
0.5% Colombian
0.2% Thai
0.4% Dominican
0.2% Bangladeshi
2.4% Other
1.0% Other
2010 U.S. Census
- [citation needed]
White : 54.8%
Black : 25.8%
Asian : 9.3%
Hispanic : 13.8%
Mixed and Other : 3.7%
2006
- [18]
White : 51.7%
Black : 26.3%
Asian : 8.4%
Hispanic : 11.6%
Mixed and Other : 2.0%
1980
- White : 67.8%
- Black : 26.0%
- Asian : 2.5%
- Hispanic : 2.8%
- Mixed and Other : 0.9%
Social indicators
The Washington metropolitan area has ranked as the highest-educated metropolitan area in the nation for four decades.[19] As of the 2006–2008 American Community Survey, the three most educated places with 200,000 people or more in Washington–Arlington–Alexandria by bachelor's degree attainment (population 25 and over) are Arlington, Virginia (68.0%), Fairfax County, Virginia (58.8%), and Montgomery County, Maryland (56.4%).[20]Forbes magazine stated in its 2008 "America's Best- And Worst-Educated Cities" report: "The D.C. area is less than half the size of L.A., but both cities have around 100,000 Ph.D.'s."[21]
The Washington, D.C. metro area has held the top spot in the American College of Sports Medicine's annual American Fitness Index ranking of the United States' 50 most populous metropolitan areas for two years running. The report cites, among other things, the high average fitness level and healthy eating habits of residents, the widespread availability of health care and facilities such as swimming pools, tennis courts, and parks, low rates of obesity and tobacco use relative to the national average, and the high median household income as contributors to the city's community health.[22]

The average household income within a 5 mi (8.0 km) radius of Tysons Corner Center is $174,809.[23]
In the 21st century, the Washington metropolitan area has overtaken the San Francisco Bay Area as the highest-income metropolitan area in the nation.[6] The median household income of the region is US$72,800. The two highest median household income counties in the nation – Loudoun and Fairfax County, Virginia – are components of the MSA (and #3 is Howard County, officially in Baltimore's sphere but strongly connected with Washington's); measured in this way, Alexandria ranks 10th among municipalities in the region – 11th if Howard is included – and 23rd in the entire United States. 12.2% of Northern Virginia's 881,136 households, 8.5% of suburban Maryland's 799,300 households, and 8.2% of Washington's 249,805 households have an annual income in excess of $200,000, compared to 3.7% nationally.[24]
According to a report by the American Human Development Project, women in the Washington metropolitan area are ranked as having the highest income and educational attainment among the 25 most populous metropolitan areas in the nation, while Asian American women in the region had the highest life expectancy, at 92.3 years.[25]
| County | 2016 Estimate | 2010 Census | Change | Area | Density |
|---|---|---|---|---|---|
Washington, D.C. | 681,170 | 601,723 | +13.20% | 61.05 sq mi (158.1 km2) | 11,157.5811,158/sq mi (4,307.964,308/km2) |
Calvert County, Maryland | 91,251 | 88,737 | +2.83% | 213.15 sq mi (552.1 km2) | 428.11428/sq mi (165.29165/km2) |
Charles County, Maryland | 157,705 | 146,551 | +7.61% | 457.75 sq mi (1,185.6 km2) | 344.52345/sq mi (133.02133/km2) |
Frederick County, Maryland | 247,591 | 233,385 | +6.09% | 660.22 sq mi (1,710.0 km2) | 375.01375/sq mi (144.79145/km2) |
Montgomery County, Maryland | 1,043,863 | 971,777 | +7.42% | 491.25 sq mi (1,272.3 km2) | 2,124.912,125/sq mi (820.43820/km2) |
Prince George's County, Maryland | 908,049 | 863,420 | +5.17% | 482.69 sq mi (1,250.2 km2) | 1,881.231,881/sq mi (726.35726/km2) |
Alexandria, Virginia | 155,810 | 139,966 | +11.32% | 15.03 sq mi (38.9 km2) | 10,366.6010,367/sq mi (4,002.574,003/km2) |
Arlington County, Virginia | 230,050 | 207,627 | +10.80% | 25.97 sq mi (67.3 km2) | 8,858.308,858/sq mi (3,420.213,420/km2) |
Clarke County, Virginia | 14,374 | 14,034 | +2.42% | 176.18 sq mi (456.3 km2) | 81.5982/sq mi (31.5032/km2) |
Culpeper County, Virginia | 50,083 | 46,689 | +7.27% | 379.23 sq mi (982.2 km2) | 132.06132/sq mi (50.9951/km2) |
Fairfax County, Virginia | 1,138,652 | 1,081,726 | +5.26% | 390.97 sq mi (1,012.6 km2) | 2,912.382,912/sq mi (1,124.481,124/km2) |
Fairfax City, Virginia | 24,164 | 22,565 | +7.09% | 6.24 sq mi (16.2 km2) | 3,872.443,872/sq mi (1,495.161,495/km2) |
Falls Church, Virginia | 14,014 | 12,332 | +13.64% | 2.00 sq mi (5.2 km2) | 7,007.007,007/sq mi (2,705.422,705/km2) |
Fauquier County, Virginia | 69,069 | 65,203 | +5.93% | 647.45 sq mi (1,676.9 km2) | 106.68107/sq mi (41.1941/km2) |
Fredericksburg, Virginia | 28,297 | 24,286 | +16.52% | 10.44 sq mi (27.0 km2) | 2,710.442,710/sq mi (1,046.511,047/km2) |
Loudoun County, Virginia | 385,945 | 312,311 | +23.58% | 515.56 sq mi (1,335.3 km2) | 748.59749/sq mi (289.03289/km2) |
Manassas, Virginia | 41,483 | 37,821 | +9.68% | 9.88 sq mi (25.6 km2) | 4,198.684,199/sq mi (1,621.121,621/km2) |
Manassas Park, Virginia | 15,915 | 14,273 | +11.50% | 2.53 sq mi (6.6 km2) | 6,290.516,291/sq mi (2,428.782,429/km2) |
Prince William County, Virginia | 455,210 | 402,002 | +13.24% | 336.40 sq mi (871.3 km2) | 1,353.181,353/sq mi (522.47522/km2) |
Rappahannock County, Virginia | 7,388 | 7,373 | +0.20% | 266.23 sq mi (689.5 km2) | 27.7528/sq mi (10.7111/km2) |
Spotsylvania County, Virginia | 132,010 | 122,397 | +7.85% | 401.50 sq mi (1,039.9 km2) | 328.79329/sq mi (126.95127/km2) |
Stafford County, Virginia | 144,361 | 128,961 | +11.94% | 268.96 sq mi (696.6 km2) | 536.74537/sq mi (207.24207/km2) |
Warren County, Virginia | 39,155 | 37,575 | +4.20% | 213.47 sq mi (552.9 km2) | 183.42183/sq mi (70.8271/km2) |
Total | 6,131,977 | 5,636,232 | +8.80% | 5,564.6 sq mi (14,412 km2) | 1,101.961,102/sq mi (425.47425/km2) |
[citation needed]
Economy

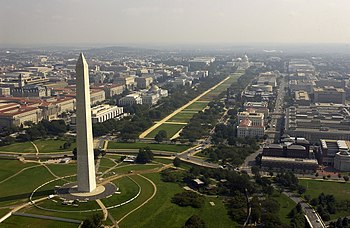
Rosslyn is home to the tallest high-rises in the region, partly due to the District's height restrictions. As a result, many of the region's tallest buildings are outside the city proper.[26][27]
The Washington, D.C. area has the largest science and engineering work force of any metropolitan area in the nation in 2006 according to the Greater Washington Initiative at 324,530, ahead of the combined San Francisco Bay Area work force of 214,500, and Chicago metropolitan area at 203,090, citing data from U.S. Census Bureau, the Bureau of Labor Statistics, Claritas Inc., and other sources.[6]
The Washington, D.C. area was ranked as the second best High-Tech Center in a statistical analysis of the top 100 Metropolitan areas in the United States by American City Business Journals in May 2009, behind the Silicon Valley and ahead of the Boston metropolitan area.[28] Fueling the metropolitan area's ranking was the reported 241,264 tech jobs in the region, a total eclipsed only by New York, Los Angeles, and the San Francisco Bay Area, as well as the highest master's or doctoral degree attainment among the 100 ranked metropolitan areas.[28] A Dice.com report showed that the Washington–Baltimore area had the second-highest number of tech jobs listed: 8,289, after the New York metro area with 9,195 jobs.[29]
Real estate and housing market
Changes in house prices for the D.C. area are publicly tracked on a regular basis using the Case–Shiller index; the statistic is published by Standard & Poor's and is also a component of S&P's 10-city composite index of the value of the U.S. residential real estate market.
McLean ZIP code 22102 had the highest median home prices among ZIP codes within the Washington metropolitan area as of 2013.[30]
Net worth, wealth disparities, and business ownership
The economy of the Washington metropolitan region is characterized by significant wealth disparities, which were heightened by the Great Recession and the 2007–09 housing crisis, which adversely affected black and Hispanic households more than other households.[31][32]
A 2016 Urban Institute report found that the median net worth (i.e., assets minus debt) for white households in the D.C. region was $284,000, while the median net worth for Hispanic/Latino households was $13,000, and for African American households as $3,500.[31][32]Asian Americans had the highest median net worth in the Washington area ($220,000 for Chinese American households, $430,000 for Vietnamese American households, $496,000 for Korean American households, and $573,000 for Indian American households).[31][32]
Although the median net worth for white D.C.-area households was 81 times that of black D.C.-area households, the two groups had comparable rates of business ownership (about 9%). The Urban Institute report suggests that this "may be driven by the presence of a large federal government and a local district government whose membership and constituents have been largely Black, coupled with government policies designed to increase contracting opportunities for minority-owned businesses."[31][32]
Primary industries
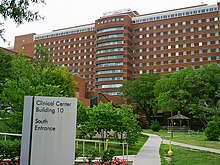
NIH Clinical Center in Bethesda.
Biotechnology
The Washington metropolitan area has a significant biotechnology industry; companies with a major presence in the region as of 2011 include Merck, Pfizer, Human Genome Sciences, Martek Biosciences, MedImmune and Qiagen.[33]
Defense contracting
Many defense contractors are based in the region to be close to the Pentagon in Arlington. Local defense contractors include Lockheed Martin, the largest, as well as Raytheon, General Dynamics, BAE Systems, Northrup Grumman,[34]Computer Sciences Corporation (CSC), Science Applications International Corporation (SAIC), CACI, and Orbital Sciences Corporation.
Tourism
Tourism is a significant industry in the Washington metropolitan region. In 2015, more than 74,000 tourism-sector jobs existed in the District of Columbia, a record-setting 19.3 million domestic tourists visited the city, and domestic and international tourists combined spent $7.1 billion.[35][36] The convention industry is also significant; in 2016, D.C. hosted fifteen "city-wide conventions" with an estimated total economic impact of $277.9 million.[35]
Tourism is also significant outside the District of Columbia; in 2015, a record-setting $3.06 billion in tourism spending was reported in Arlington, Virginia, and $2.9 billion in Fairfax County, Virginia.[37] A 2016 National Park Service report estimated that there were 56 million visitors to national parks in the National Capital Region, sustaining 16,917 and generating close to $1.6 billion in economy impact.[38]
Largest companies

Capital One Tower in Tysons, the tallest building in the region and centerpiece of the 5,000,000 sq ft (464,500 m2) headquarter campus for Capital One.[39]
| Company | Industry | Headquarters | National rank |
|---|---|---|---|
AES Corporation | Energy | Arlington, Virginia | 214 |
Booz Allen Hamilton | Defense | McLean, Virginia | 482 |
Capital One | Finance | McLean, Virginia | 101 |
Danaher Corporation | Conglomerate | Washington, D.C. | 162 |
DXC Technology | Information technology | Tysons, Virginia | 374 |
Discovery Communications | Mass media | Silver Spring, Maryland | 409 |
Fannie Mae | Finance | Washington, D.C. | 21 |
Freddie Mac | Finance | McLean, Virginia | 38 |
General Dynamics | Defense | Falls Church, Virginia | 99 |
Hilton Hotels Corporation | Hospitality | McLean, Virginia | 324 |
Leidos | Defense | Reston, Virginia | 292 |
Lockheed Martin | Defense | Bethesda, Maryland | 59 |
Marriott International | Hospitality | Bethesda, Maryland | 127 |
Northrop Grumman | Defense | Falls Church, Virginia | 118 |
NVR, Inc. | Construction | Reston, Virginia | 444 |
| Company | Industry | Headquarters | National rank |
|---|---|---|---|
| BrightView | Landscaping | Rockville, Maryland | 220 |
Carahsoft | Defense | Reston, Virginia | 161 |
Clark Construction | Construction | Bethesda, Maryland | 102 |
Mars, Incorporated | Food processing | McLean, Virginia | 7 |
History

NGA headquarters in Fort Belvoir.
The 2005 Base Realignment and Closure resulted in a significant shuffling of military, civilian, and defense contractor employees in the Washington, D.C., area. The largest individual site impacts of the time are as follows:[42]
Fort Belvoir gained 11,858 employees, primarily as a result of the relocation of the National Geospatial-Intelligence Agency (NGA) into a massive new headquarters within the fort.
Fort Meade gained 5,361 employees, primarily as a result of the expansion of the National Security Agency.
Walter Reed Army Medical Center lost 5,630 employees as part of its realignment. It was later closed and consolidated into Walter Reed National Military Medical Center.
BRAC 2005 was the largest infrastructure expansion by the Army Corps of Engineers since World War II, resulting in the Mark Center, tallest building they have ever constructed, as well as National Geospatial-Intelligence Agency Campus East, which at 2.4 million square feet is the largest building the Corps have constructed since the Pentagon.[43]
Transportation
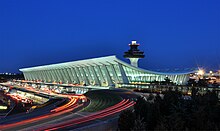
Washington Dulles International Airport
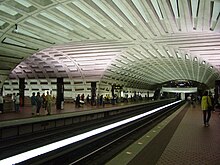
The Metro Center station on the Washington Metro
'WMATA'-indicated systems are run by Washington Metropolitan Area Transit Authority and always accept Washington Metro fare cards, others may or may not.
Major airports
Washington Dulles International Airport (IAD), located in Dulles, Virginia
Ronald Reagan Washington National Airport (DCA), located in Arlington County, Virginia – the closest to Washington
Baltimore–Washington International Thurgood Marshall Airport (BWI), located in Linthicum, Maryland – in the Baltimore metropolitan area and the busiest in the region
Rail transit systems
Washington Metro – DC, MD, VA (rapid transit) (WMATA)
MARC Train – DC, MD, WV (commuter rail)
Virginia Railway Express – DC, VA (commuter rail)
Amtrak – US (commuter rail, inter-city rail)
Bus transit systems
DC Circulator – Washington, D.C. (DDoT, WMATA)
Metrobus – Washington metropolitan area (WMATA)
Metroway – Arlington County, Virginia and Alexandria, Virginia (bus rapid transit) (WMATA)
Ride On – Montgomery County, Maryland
TheBus – Prince George's County, Maryland
ART – Arlington County, Virginia
DASH – Alexandria, Virginia
Fairfax Connector – Fairfax County, Virginia
CUE Bus – Fairfax, Virginia
Loudoun County Transit – Loudoun County, Virginia
PRTC – Prince William County, Manassas and Manassas Park
TransIT – Frederick County, Maryland
Regional Transportation Agency of Central Maryland – Howard County, Anne Arundel County, Prince George's County, Laurel, Maryland
Maryland Transit Administration – Washington, D.C., Montgomery County, Maryland, Prince George's County, Frederick County, Maryland, Charles County, Maryland, Calvert County, Maryland, Howard County, Anne Arundel County, Saint Mary's County, Maryland
Eastern Panhandle Transit Authority – Jefferson County, West Virginia, Berkeley County, West Virginia
Virginia Regional Transit – Loudoun County, Virginia, Culpeper County, Virginia, Fauquier County, Virginia, Warren County, Virginia
Fredericksburg Regional Transit – Fredericksburg, Spotsylvania County and Stafford County
Major roads
Capital Beltway – Maryland and Virginia
Bicycle sharing
Capital Bikeshare – Washington, D.C., Arlington, Virginia, Alexandria, Virginia, Fairfax County, Virginia, Prince George's County, Maryland, and Montgomery County, Maryland
Culture
Sports teams
Listing of the professional sports teams in the Washington metropolitan area:
National Basketball Association (NBA)
- Washington Wizards
Major League Baseball (MLB)
- Washington Nationals
National Football League (NFL)
- Washington Redskins
National Hockey League (NHL)
- Washington Capitals
Major League Soccer (MLS)
- D.C. United
Women's National Basketball Association (WNBA)
- Washington Mystics
Atlantic League of Professional Baseball (ALPB)
- Southern Maryland Blue Crabs
Arena Football League (AFL)
- Washington Valor
National Women's Soccer League (NWSL)
- Washington Spirit
NBA G League
- Capital City Go-Go
USL Championship
- Loudoun United FC
Media
The Washington metropolitan area is home to USA Today, C-SPAN, PBS, NPR, POLITICO, BET, TV One and Discovery Communications. The two main newspapers are The Washington Post and The Washington Times. Local television channels include WRC-TV 4 (NBC), WTTG 5 (FOX), WJLA 7 (ABC), WUSA 9 (CBS), WDCA 20 (MyNetworkTV), WETA-TV 26 (PBS), WDCW 50 (CW), and WPXW 66 (Ion). WJLA 24/7 News is a local news provider available only to cable subscribers. Radio stations serving the area include: WETA-FM, WIHT, WMAL-AM, and WTOP.
Area codes
- 202 – Washington, D.C.
- 571/703 – Northern Virginia including the cities of Alexandria, Fairfax, and Falls Church as well as Arlington, Fairfax, and Loudoun counties (571 created March 1, 2000; 703 in October 1947).
- 240/301 – portions of Maryland in the Greater Washington, D.C. metro area, southern Maryland, and western Maryland
- 540 – Fredericksburg/Spotsylvania/Warrenton
- 304/681 – Jefferson County, West Virginia
Sister cities
| City | Country | Year |
|---|---|---|
Washington, D.C. | ||
Bangkok | 1962, renewed 2002 | |
Dakar | 1980, renewed 2006 | |
| Beijing | 1984, renewed 2004 | |
Brussels | 1985, renewed 2012 | |
Athens | 2000 | |
| Paris[Note 1] | 2000, renewed 2005 | |
Pretoria | 2002, renewed 2008 | |
Seoul | 2006 | |
Accra | 2006 | |
Sunderland | 2006 | |
Alexandria, Virginia | ||
Gyumri | ||
Helsingborg | ||
Dundee[Note 2] | ||
Caen | ||
Arlington County, Virginia | ||
Aachen | ||
Reims | ||
San Miguel | ||
Coyoacán | ||
Ivano-Frankivsk[Note 3] | ||
Herndon, Virginia | ||
Runnymede[Note 4] | ||
Fairfax County, Virginia | ||
Harbin[Note 5] | 2009 | |
Songpa-gu[Note 6] | 2009 | |
Falls Church, Virginia | ||
Kokolopori | ||
District Heights, Maryland | ||
Mbuji-Mayi | ||
Frederick, Maryland | ||
Aquiraz | ||
Moerzheim | ||
Schifferstadt | ||
La Plata, Maryland | ||
Jogeva County | ||
Walldorf | ||
Rockville, Maryland | ||
Pinneberg |
^ Paris is a "Partner City" due to the one Sister City policy of that commune.[1]
^ "Historic Alexandria | City of Alexandria, VA". Oha.alexandriava.gov. Retrieved November 19, 2012..mw-parser-output cite.citation{font-style:inherit}.mw-parser-output .citation q{quotes:"""""""'""'"}.mw-parser-output .citation .cs1-lock-free a{background:url("//upload.wikimedia.org/wikipedia/commons/thumb/6/65/Lock-green.svg/9px-Lock-green.svg.png")no-repeat;background-position:right .1em center}.mw-parser-output .citation .cs1-lock-limited a,.mw-parser-output .citation .cs1-lock-registration a{background:url("//upload.wikimedia.org/wikipedia/commons/thumb/d/d6/Lock-gray-alt-2.svg/9px-Lock-gray-alt-2.svg.png")no-repeat;background-position:right .1em center}.mw-parser-output .citation .cs1-lock-subscription a{background:url("//upload.wikimedia.org/wikipedia/commons/thumb/a/aa/Lock-red-alt-2.svg/9px-Lock-red-alt-2.svg.png")no-repeat;background-position:right .1em center}.mw-parser-output .cs1-subscription,.mw-parser-output .cs1-registration{color:#555}.mw-parser-output .cs1-subscription span,.mw-parser-output .cs1-registration span{border-bottom:1px dotted;cursor:help}.mw-parser-output .cs1-ws-icon a{background:url("//upload.wikimedia.org/wikipedia/commons/thumb/4/4c/Wikisource-logo.svg/12px-Wikisource-logo.svg.png")no-repeat;background-position:right .1em center}.mw-parser-output code.cs1-code{color:inherit;background:inherit;border:inherit;padding:inherit}.mw-parser-output .cs1-hidden-error{display:none;font-size:100%}.mw-parser-output .cs1-visible-error{font-size:100%}.mw-parser-output .cs1-maint{display:none;color:#33aa33;margin-left:0.3em}.mw-parser-output .cs1-subscription,.mw-parser-output .cs1-registration,.mw-parser-output .cs1-format{font-size:95%}.mw-parser-output .cs1-kern-left,.mw-parser-output .cs1-kern-wl-left{padding-left:0.2em}.mw-parser-output .cs1-kern-right,.mw-parser-output .cs1-kern-wl-right{padding-right:0.2em}
^ Exploration phase
^ Town twin [2]
^ Rejected by Washington due to not being a national capital.[3]
^ "Sisterhood Partnerships". Fairfaxcounty.gov. Archived from the original on March 21, 2016. Retrieved November 19, 2012.
See also
- List of people from the Washington, D.C. metropolitan area
- List of U.S. metropolitan statistical areas in Virginia
- Potomac primary
- Northeast megalopolis
References
^ "After initial obscurity, 'The DMV' nickname for Washington area picks up speed". Washington Post. July 30, 2010.
^ Yager, Jane (July 30, 2010). "Nation's Capitol Now Known as 'the DMV'". Newser. Retrieved March 11, 2016.
^ "Annual Estimates of the Resident Population: April 1, 2010 to July 1, 2016: MSA". 2016 Population Estimates. United States Census Bureau, Population Division. March 2016. Retrieved March 6, 2018.
^ "Annual Estimates of the Resident Population: April 1, 2010 to July 1, 2016: CSA". 2016 Population Estimates. United States Census Bureau, Population Division. March 2016. Retrieved March 6, 2018.
^ "Census Urban Area List". United States Census Bureau. 2010. Retrieved March 6, 2018.
^ abc "Washington area richest, most educated in US: report". Washingtonpost.com. June 8, 2006. Retrieved November 19, 2012.
^ Clabaugh, Jeff (22 March 2018). "Washington metro population climbs to 6.2 million". WTOP News. Retrieved 28 January 2019.
^ "Four Texas Metro Areas Collectively Add More Than 400,000 People in the Last Year, Census Bureau Reports". United States Census Bureau.
^ "Census Bureau Regions and Divisions with State FIPS Codes" (PDF). US Census Bureau. Retrieved August 30, 2018.
^ "Archived copy". Archived from the original on April 17, 2016. Retrieved March 26, 2015.CS1 maint: Archived copy as title (link)
^ "Archived copy". Archived from the original on May 10, 2016. Retrieved April 30, 2016.CS1 maint: Archived copy as title (link)
^ "National Capital Region – Office of National Capital Region Coordination". Department of Homeland Security. December 21, 2005. Archived from the original on December 12, 2007. Retrieved January 9, 2008.
^ ab "Revised Delineations of Metropolitan Statistical Areas, Micropolitan Statistical Areas, and Combined Statistical Areas, and Guidance on Uses of the Delineations of These Areas" (PDF). Office of Management and Budget. February 20, 2013. Archived from the original (PDF) on April 18, 2013. Retrieved May 9, 2013.
^ "About Us". MWCOG.org. Retrieved November 19, 2012.
^ "– Transportation – TPB". Mwcog.org. Retrieved November 19, 2012.
^ "OMB Bulletin No. 13-01: Revised Delineations of Metropolitan Statistical Areas, Micropolitan Statistical Areas, and Combined Statistical Areas, and Guidance on Uses of the Delineations of These Areas" (PDF). U.S. Office of Management and Budget. February 28, 2013. Retrieved May 14, 2014.
^ Frey, William H. (February 2002). "Metro Magnets for Minorities and Whites: Melting Pots, the New Sunbelt, and the Heartland" (PDF). Population Studies Center at the University of Michigan. Retrieved November 19, 2012.
^ "Annual Estimates of the Resident Population by Sex, Race Alone and Hispanic or Latino Origin for Counties: April 1, 2000 to July 1, 2006". Archived from the original on June 10, 2010. Retrieved January 12, 2016.
^ de Vise, Daniel (July 15, 2010). "Washington region ranks as the best-educated in the country". Washingtonpost.com. Retrieved November 19, 2012.
^ "2006–2008 American Community Survey 3-Year Estimates". United States Census Bureau. Retrieved November 19, 2012.
^ Zumbrun, Joshua (November 24, 2008). "America's Best- And Worst-Educated Cities". Forbes.com. Retrieved November 19, 2012.
^ "Washington, DC (Washington–Arlington–Alexandria, DC–VA–MD–WV MSA) 2010 AFI Report" (PDF). Archived from the original (PDF) on August 12, 2011. Retrieved May 26, 2010.
^ "Macerich Tysons Corner Center Market Profile" (PDF). Archived from the original (PDF) on September 3, 2013.
^ "ACS 2005–2007". United States Census Bureau. Retrieved November 19, 2012.
^ "Women'S Well-Being" (PDF). Retrieved November 19, 2012.
^ Downey, Kirstin (May 6, 2007). "High-Rises Approved That Would Dwarf D.C". Washingtonpost.com. Retrieved November 19, 2012.
^ "List of tallest buildings in DC, MD, VA, WV". Skyscraperpage.com. Retrieved November 19, 2012.
^ ab "The top 100 tech centers". Bizjournals. May 11, 2009. Archived from the original on February 16, 2010. Retrieved March 3, 2010.
^ Nathan Eddy (March 13, 2012). "Tech Jobs Flourish in Silicon Valley, but Other Regions Offer Opportunities: Dice Report". Eweek.com. Retrieved November 19, 2012.
^ Brennan, Morgan. "America's Most Expensive Zip Codes In 2013: The Complete List". Forbes. Archived from the original on March 4, 2016.
^ abcd Perry Stein, Net worth of white households in D.C. region is 81 times that of black households,Washington Post (November 2, 2016).
^ abcd Kilolo Kijakazi et al., The Color of Wealth in the Nation's Capital, Urban Institute (October 31, 2016).
^ Renee Winsky & Mark Herzog, Maryland, Virginia biotech industries take center stage in D.C., Washington Business Journal (June 28, 2011).
^ Censer, Marjorie (July 30, 2010). "Defense firm Northrop Grumman's second-quarter profit rose nearly 81 percent". The Washington Post.
^ ab Perry Stein, D.C. breaks tourist record in 2015 with visitors spending $7.1 billion, Washington Post (May 3, 2016).
^ Ben Nuckols, DC sets record with more than 2 million foreign tourists, Associated Press (August 24, 2016).
^ Arlington County Sets Tourism Spending Record with $3 Billion, CBS Washington (September 19, 2016).
^ Tourism at national parks in the Greater Washington area generates almost $1.6 billion in economic benefit (press release), National Park Service (April 21, 2016).
^ "Positive review for Capital One's massive headquarters in Tysons". American City Business Journals.
^ "Fortune 500". Fortune.com. Retrieved December 4, 2018.
^ "America's Largest Private Companies". Forbes. Retrieved June 24, 2017.
^ Appendix C BRAC 2005 Closure and Realignment Impacts by State
^ Justin Matthew Ward (September 14, 2011). "BRAC 2005: on time, on budget in Northeast". army.mil.
External links
| Wikivoyage has a travel guide for Washington, D.C. area. |
- OMB Bulletin No. 05-02
- Urban Areas of Virginia
- May 2006 Metropolitan and Nonmetropolitan Area Occupational Employment and Wage Estimates; Washington–Arlington–Alexandria, DC–VA–MD–WV Metropolitan Division
- May 2005 Metropolitan Area Occupational Employment and Wage Estimates; Washington–Arlington–Alexandria, DC–VA–MD–WV Metropolitan Division
- Washington–Arlington–Alexandria, DC–VA–MD–WV MSA Population and Components of Change
Washington–Arlington–Alexandria, DC–VA–MD–WV metropolitan area | ||||||||
|---|---|---|---|---|---|---|---|---|
| Principal cities |
|   | ||||||
| Counties and county equivalents* |
| |||||||
The District of Columbia itself, and Virginia's incorporated cities, are county equivalents. Virginia's incorporated cities are listed under their surrounding county. The incorporated cities bordering more than one county (Alexandria, Falls Church and Fredericksburg) are listed under the county they were part of before incorporation as a city. | ||||||||
| ||
| Topics |
|  Seal of the District of Columbia |
| Government |
| |
| Services |
| |
| Society |
| |
| History |
| |
Richmond (capital) | ||
| Topics |
|  Seal of Virginia |
| Culture |
| |
| Regions |
| |
| Metro areas |
| |
| Counties |
| |
| Independent cities |
| |
Annapolis (capital) | |
| Topics |
|
| Society |
|
| Regions |
|
| Cities |
|
| Towns |
|
| CDPs |
|
| Counties |
|
Charleston (capital) | ||
| Topics |
|  Seal of West Virginia |
| Society |
| |
| Insignia |
| |
| Regions |
| |
| Metro areas |
| |
| Largest cities |
| |
| Counties |
| |
Coordinates: 38°53′12.33″N 77°2′29.85″W / 38.8867583°N 77.0416250°W / 38.8867583; -77.0416250


